Fig. 13
Download original image
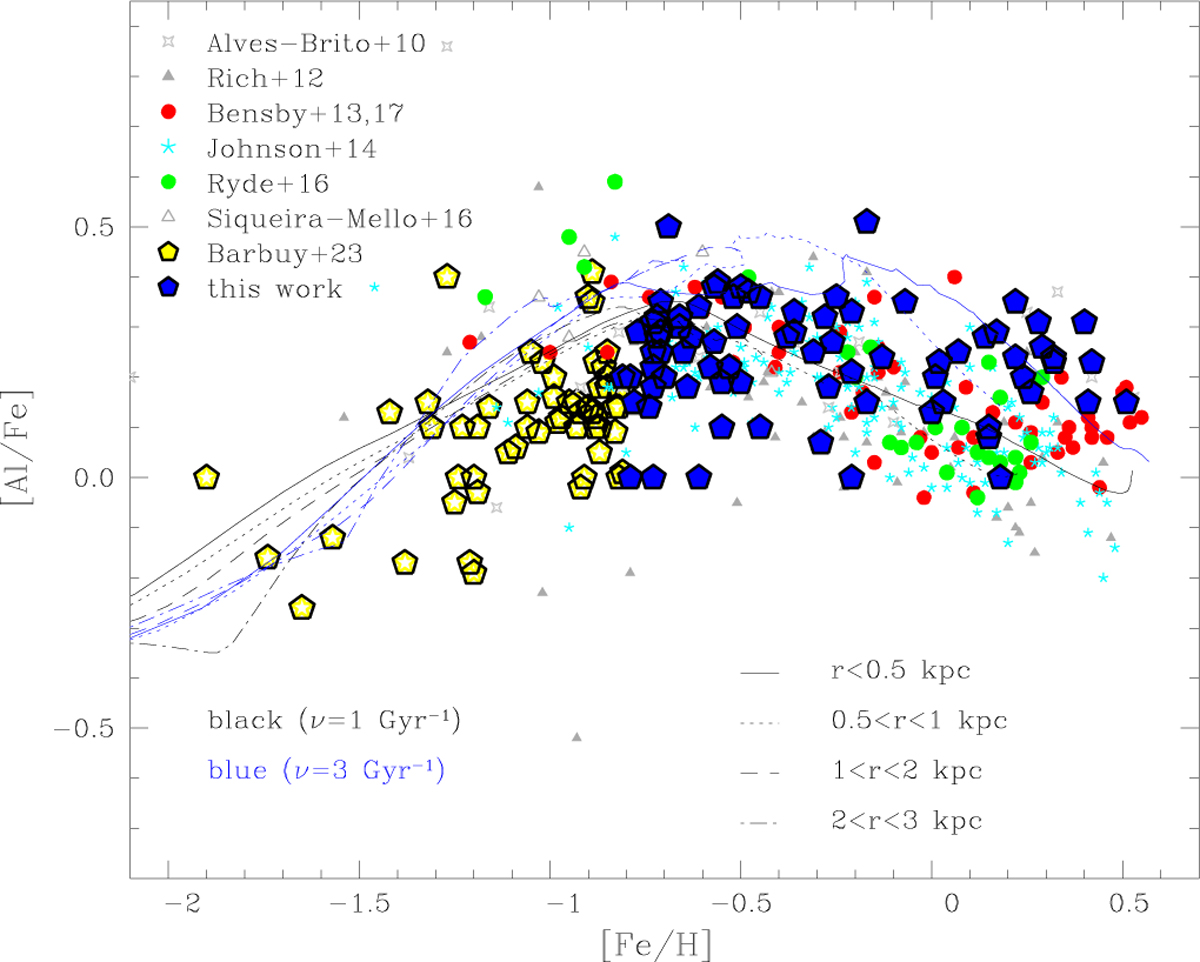
[Al/Fe] versus [Fe/H] for the present results compared with literature bulge samples and chemical evolution models. Blue pentagons refer to this work; four-pointed grey stars to Alves-Brito et al. (2010); filled red circles to Bensby et al. (2017); filled grey triangles and cyan stars to Johnson et al. (2014); filled green circles to Ryde et al. (2016); open grey triangles to Siqueira-Mello et al. (2016); and yellow pentagons to Barbuy et al. (2023). Chemodynamical-evolution models with star formation rate of ν=1 and 3 Gyr−1 or formation timescale of 1 and 0.3 Gyr are over-plotted.
Current usage metrics show cumulative count of Article Views (full-text article views including HTML views, PDF and ePub downloads, according to the available data) and Abstracts Views on Vision4Press platform.
Data correspond to usage on the plateform after 2015. The current usage metrics is available 48-96 hours after online publication and is updated daily on week days.
Initial download of the metrics may take a while.