Fig. 14
Download original image
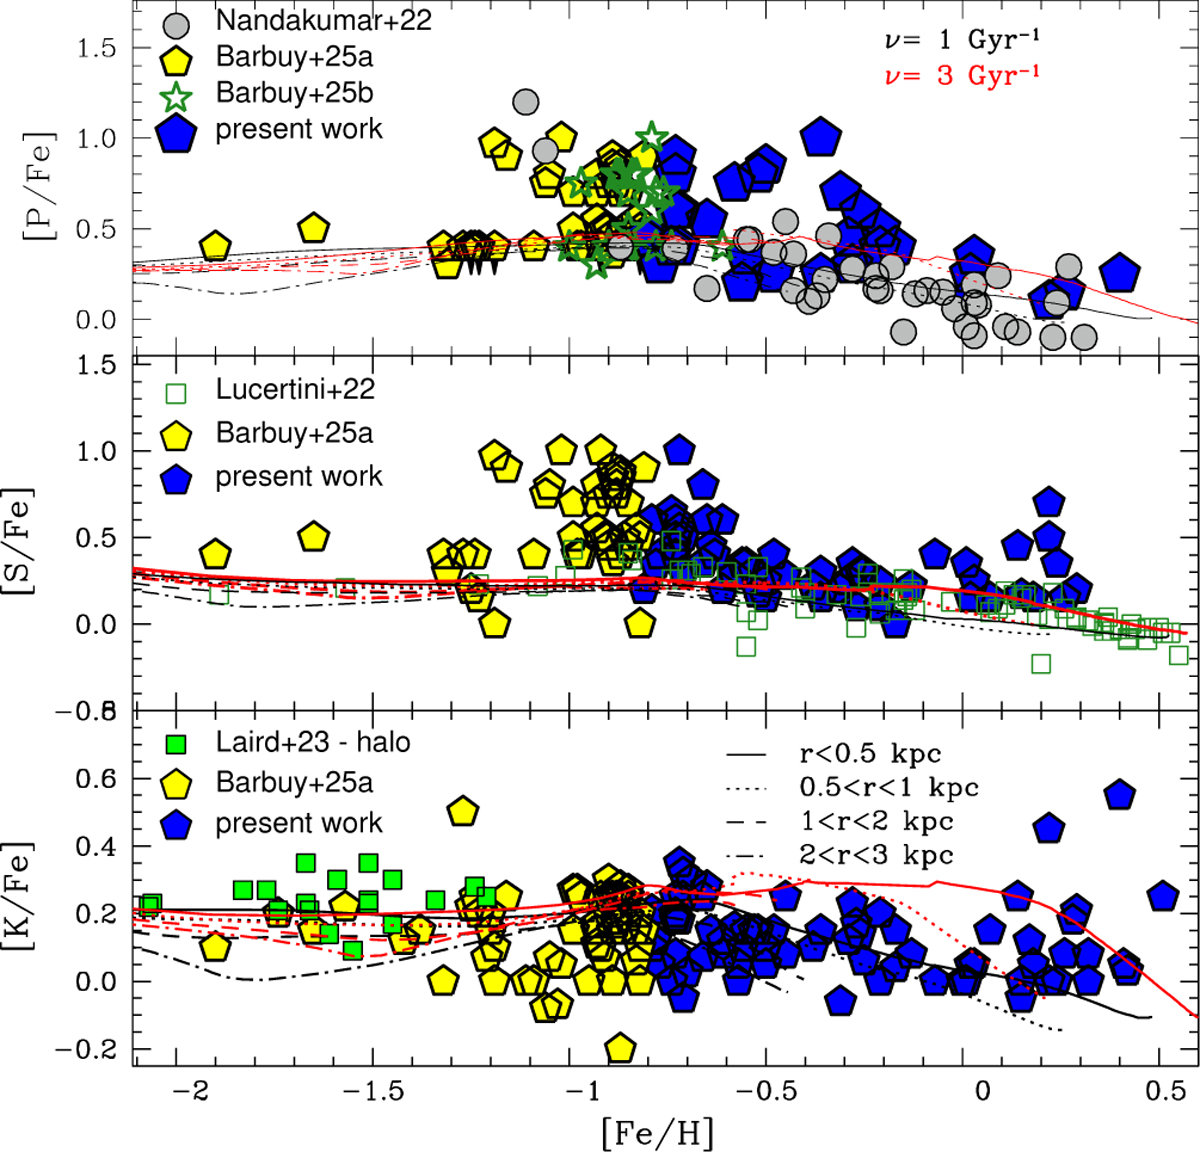
[P/Fe] versus [Fe/H] (upper panel), [S/Fe] versus [Fe/H] (middle panel), and [K/Fe] versus [Fe/H] (lower panel) for the present data compared with literature and chemical evolution models. Blue pentagons show the present results, and yellow pentagons show those of Barbuy et al. (2025a). For P, dark green open stars are for Barbuy et al. (2025b), filled light grey circles for Nandakumar et al. (2022). For S, open forest green squares are for Lucertini et al. (2022). For K, filled green circles show the Reinhard & Laird (2024) results. Different model lines correspond to the outputs of models computed for radii r < 0.5, 0.5 < r < 1, 1 < r < 2, and 2 < r < 3 kpc from the Galactic centre. Black lines correspond to a specific star formation of ν =1 Gyr−1, while red lines show ν = 3 Gyr−1.
Current usage metrics show cumulative count of Article Views (full-text article views including HTML views, PDF and ePub downloads, according to the available data) and Abstracts Views on Vision4Press platform.
Data correspond to usage on the plateform after 2015. The current usage metrics is available 48-96 hours after online publication and is updated daily on week days.
Initial download of the metrics may take a while.