| Issue |
A&A
Volume 707, March 2026
|
|
|---|---|---|
| Article Number | A72 | |
| Number of page(s) | 8 | |
| Section | Interstellar and circumstellar matter | |
| DOI | https://doi.org/10.1051/0004-6361/202558794 | |
| Published online | 03 March 2026 | |
From chemical space to observational priority: Predicting detectable molecules in IRC+10216
1
Laboratory for Relativistic Astrophysics, Department of Physics, Guangxi University,
530004
Nanning,
China
2
School of Physics and Astronomy, Sun Yat-sen University,
519082
Zhuhai,
China
★ Corresponding author: This email address is being protected from spambots. You need JavaScript enabled to view it.
Received:
26
December
2025
Accepted:
30
January
2026
Abstract
Context. IRC+10216 is a carbon-rich asymptotic giant branch star surrounded by a dense, chemically rich circumstellar envelope (CSE). Although a diverse array of molecules has been detected, the full molecular inventory of the envelope and the formation pathways of more complex species remain poorly understood.
Aims. This study aims to systematically identify plausible new molecular candidates in the CSE of IRC+10216, predict their column densities, and prioritize the most promising targets for observational detection using a combined cheminformatics and machine learning approach.
Methods. We conducted a structural similarity search based on known molecular species using extended connectivity fingerprints, retrieving 1133 plausible candidates from chemical databases. A support vector regression model was trained to predict their column densities. The resulting candidates were filtered using criteria based on elemental abundance, kinetic plausibility, and spectral line intensities to identify observationally feasible targets.
Results. The filtering process reduced the candidate list to 30 high-priority molecules with entries in spectroscopic catalogs. Density functional theory calculations provided key molecular properties for these species, including optimized geometries, formation energies, dipole moments, zero-point vibrational energies, and rotational constants.
Conclusions. The integrated framework developed here enables efficient identification and prioritization of plausible molecular candidates in IRC+10216.
Key words: astrochemistry / methods: data analysis / ISM: molecules
© The Authors 2026
 Open Access article, published by EDP Sciences, under the terms of the Creative Commons Attribution License (https://creativecommons.org/licenses/by/4.0), which permits unrestricted use, distribution, and reproduction in any medium, provided the original work is properly cited.
This article is published in open access under the Subscribe to Open model. This email address is being protected from spambots. You need JavaScript enabled to view it. to support open access publication.
1 Introduction
IRC+10216 is a variable, carbon-rich star enveloped by a dense dust shell and located approximately 123 pc away (Groenewegen et al. 2012). As it approaches the end of its asymptotic giant branch phase, the star undergoes the third dredge-up and substantial mass loss. This mass ejection results in the formation of a carbon-rich circumstellar envelope (CSE), shaped by the combined effects of gravitational confinement and radiation pressure (Kwan & Hill 1977). The molecular inventory of this CSE serves as a chemical archive, reflecting successive episodes of mass loss over time (Kwan & Linke 1982; Ziurys 2006).
Since the first detections of CN (Wilson et al. 1971), over a hundred distinct molecular species have been identified within the CSE of IRC+10216. These species predominantly include carbon chains, ionized organic molecules, metal cyanides and isocyanides, as well as halogenated compounds. This molecular diversity underscores the complex and dynamic chemical environment within the CSE, providing critical information on mass loss processes, local radiation fields, thermodynamic evolution, gas dynamics, chemical pathways, and dust formation during the late stages of stellar evolution (Martin & Rogers 1987; Pulliam et al. 2011; Cernicharo et al. 2023; Zuckerman et al. 1986; Ziurys et al. 2002). Nevertheless, it is widely accepted that the currently known species represent only a fraction of the total molecular inventory.
The continued discovery of new molecules in the CSE of IRC+10216 is essential to advance our understanding of stellar evolution at its terminal stages. However, identifying new species remains a significant challenge. Traditionally, researchers have relied on chemical intuition to propose potential molecules, comparing their spectra with those observed. This process is both time-consuming and prone to errors. Furthermore, factors such as low molecular abundances, incomplete spectral data, as well as the congestion and overlap of spectral lines from multiple species complicate detection efforts.
To address these challenges, Lee et al. (2021) proposed a strategy that integrates cheminformatics with machine learning (ML) techniques. Using a dataset of previously detected molecules, their method effectively predicted candidate species and their abundances in Taurus Molecular Cloud-1 (TMC-1). This approach was subsequently extended to Orion KL, revealing new insights into the chemical complexity of star-forming regions (Scolati et al. 2023). In the present study, we applied a similar ML-based framework, with modifications tailored to IRC+10216, to investigate its molecular inventory. Our objective is to generate a curated list of candidate molecules that may guide future astronomical surveys and spectral analyses.
2 Methods
The general workflow of this study is described in Figure 1 and comprises three main tasks. First (purple arrow), candidate molecular species were selected from standard chemical databases using molecular similarity searches based on previously identified compounds. Second (blue arrow), ML models were trained on observational data from known molecules to predict the column densities of these candidates. Third (orange arrow), quantum chemical calculations were employed to estimate the relevant chemical and spectroscopic properties of the selected molecules, thereby providing theoretical support for future astronomical detections. Detailed descriptions of the methodologies applied in each task are presented in the following subsections.
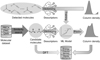 |
Fig. 1 Schematic of the workflow of this study. |
2.1 Detected molecules
The dataset of detected molecules used in this study is based on species identified in the CSE of IRC+10216, as compiled by Tuo et al. (2024). This compilation combines the authors’ own observational results with an extensive survey of molecular detections reported in the literature. The column density values employed in our analysis were likewise taken from this source and the references therein. All 106 detected species are tabulated in the Supplementary Information (see Data Availability section).
Figure 2 presents a visualization of these species in chemical space through uniform manifold approximation and projection (UMAP) (McInnes et al. 2018). In this representation, smaller molecules cluster on the right, whereas larger carbon-chain compounds occupy the left side. Distinct clusters corresponding to nitrogen-, sulfur-, and oxygen-bearing species indicate that the constituent elements are a primary factor governing the organization of molecules within the projected chemical space. The distribution along the dashed line suggests a continuous chemical progression from small to extended carbon-chain species, hinting at a possible pathway of molecular growth within the CSE of IRC+10216. The diversity of detected molecules emphasizes the rich and complex chemistry occurring within IRC+10216’s CSE, though these detections likely account for only a portion of the full molecular inventory.
It should be noted that for several species, such as C3O (Tenenbaum et al. 2006), CH2NH (Tenenbaum et al. 2010), H2C3 (Cernicharo et al. 1991), and SiC6 (Pardo et al. 2022), the column densities were originally reported as beam-averaged values derived from telescope beam widths. To ensure consistency across the dataset, these values were converted to source-averaged column densities using the beam dilution correction given by the following equation:
![Mathematical equation: $\[\eta_{\mathrm{BD}}=\frac{\theta_{\mathrm{s}}^2}{\theta_{\mathrm{s}}^2+\theta_{\text {beam }}^2},\]$](/articles/aa/full_html/2026/03/aa58794-25/aa58794-25-eq1.png) (1)
(1)
where θs is the source size. In this work, we adopted a value of θs = 30″, corresponding to the typical angular scale of the molecular shell where radical species and carbon chains reach their peak abundance (Cernicharo et al. 2000).
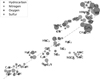 |
Fig. 2 UMAP visualization of the 106 detected molecules in chemical space. The colored circles represent different element categories, while their sizes indicate molecular column density. |
Composition of the molecular pool.
2.2 Molecular search
Candidate molecules were selected from a combined molecular dataset through structural similarity searches based on the previously detected species. The molecular pool comprises 2 158 984 unique compounds collected from several well-established chemical databases, including PubChem (Kim et al. 2021), PubChem BioAssay (PCBA) (Wang et al. 2012), ZINC (Sterling & Irwin 2015), GDB-17 (Ruddigkeit et al. 2012), and Quantum Machine 9 (QM9) (Ramakrishnan et al. 2014), as summarized in Table 1. In addition, a small curated subset of molecules previously detected in TMC-1 (Lee et al. 2021) was incorporated to enhance the astronomical relevance of the dataset. After merging the datasets, molecular redundancy was removed by computing their canonical SMILES string using RDKit1.
The molecular similarity search follows the general strategy proposed by Lee et al. (2021), with the key difference being the choice of molecular descriptor. Here, we employed the extended connectivity fingerprint (ECFP) (Rogers & Hahn 2010), a circular fingerprint widely recognized for its effectiveness in identifying structurally related compounds, particularly in cheminformatics and drug discovery. The ECFP descriptors were generated using the RDKit implementation, which is based on a modified version of the Morgan algorithm originally developed for canonical atom numbering in molecular graphs (Morgan 1965).
The ECFP encodes the local atomic environments and bonding topology of each non-hydrogen atom into a series of concentric layers, extending up to a specified cutoff radius (Rcut = 3 in this study). Within each layer, the atomic neighborhoods were iteratively hashed into unique numerical identifiers, each representing a distinct molecular substructure. The final fingerprint was then obtained by aggregating these identifiers into a single digital vector that compactly captures the molecule’s structural features.
Importantly, although ECFP and mol2vec (Jaeger et al. 2018) rely on the topology of the molecule, they serve as a proxy for shared chemical heredity in astrochemistry. Molecular growth in the interstellar medium often occurs through modular extensions of core skeletons, for example, by elongating carbon chains or attaching functional groups. As highlighted in reviews by Herbst & van Dishoeck (2009) and McGuire (2022), interstellar molecules frequently appear in distinct chemical families. Thus, a high degree of structural similarity, as quantified by ECFP, offers a statistical link to established reaction networks, suggesting that molecules share common precursors or parallel formation pathways (Agúndez et al. 2014; Pardo et al. 2022).
After converting the molecular structures into ECFP representations, we performed a structural similarity search to identify candidate molecules lying close to the 106 detected species in the chemical space. The similarity between the detected and candidate molecules was quantified using the cosine similarity of their ECFP vectors. For each detected species, the top 100 candidates with the highest similarity scores were selected. After duplicates were removed, only molecules sharing the same charge state as the detected species were retained.
To account for the carbon-rich environment of IRC+10216, a post-prediction filtering step was applied based on elemental abundance constraints and kinetic plausibility. Although nonequilibrium processes such as shock waves in the inner wind (Cherchneff 2012) and photochemistry in the inner layers (Agúndez et al. 2010; Van de Sande & Millar 2022) permit the formation of certain oxygenated species such as H2O (Decin et al. 2010), highly saturated and oxygen-rich candidates were flagged as kinetically disfavored. This is due to the absence of efficient formation pathways for complex saturated species in this radical-dominated astrophysical environment (Abplanalp et al. 2016; Ferrero et al. 2023). We assigned each molecule to one of three prioritization tiers based on the chemical criteria outlined in Section 3.1. Lastly, the candidates were subsequently subjected to ML and quantum chemical calculations to predict their column densities and other relevant physical and spectroscopic properties.
2.3 Column density prediction
Following candidate identification, we used a ML regression framework to predict the column densities of the unobserved species. To transform the molecular structures into machine-readable features suitable for regression, we employed a specific feature engineering strategy. The primary input features consisted of ECFP bit-vectors generated with a radius of 3 and a fixed length of 2048 bits. Recognizing the critical role of ionization in the chemistry of the CSE, we explicitly incorporated charge information. The molecular charge state (anion, neutral, or cation) was first converted into a one-hot encoded vector. To ensure this electronic feature significantly contributed to the distance-based regression calculations, we applied a feature weighting strategy wherein the one-hot charge vector was tiled five times and concatenated with the 2048-bit structural fingerprint, yielding a final feature vector of 2063 dimensions. For comparative analysis, we also evaluated the performance of mol2vec, a continuous embedding approach, to benchmark the efficacy of our ECFP-based representation.
Given the limited sample size of the training set (106 detected molecules), we implemented a data augmentation procedure to enhance model robustness and prevent overfitting. For each training sample with a known column density log10 N, we generated ten augmented instances by injecting Gaussian noise into the target variable, such that yaug = log10 N + ϵ, where ϵ ~ 𝒩(0, 0.52). This augmentation strategy forces the model to learn the underlying structural trends rather than memorizing exact abundance values.
We evaluated four distinct ML algorithms: gradient boosting regression (GBR), K-nearest neighbors (KNN), random forest regression (RFR), and support vector regression (SVR), all implemented in the scikit-learn library. To ensure reliable predictions and quantify uncertainty, we adopted a Monte Carlo cross-validation approach. The modeling process involved ten independent runs; in each iteration, the augmented dataset was randomly partitioned into a training set (70%) and a validation set (30%). The final predicted value for each candidate was derived by averaging the logarithmic column densities (log10 N) across these ten runs. Our ML code is available on Git repository: MLColumnDensity.
To explicitly quantify the stability of the predictions as presented in Figure 3, we used the mean standard deviation (MSD) as a performance metric. For every candidate molecule, we first calculated the standard deviation (SD) of its predicted values across the ten independent runs. The MSD was then defined as the arithmetic mean of these individual SD values across the entire set of candidate molecules. A lower MSD value indicates higher consistency and stability in the model’s predictions. As illustrated in Figure 3, the SVR model coupled with the high-dimensional ECFP representation achieved the lowest MSD, demonstrating superior stability compared to other algorithms and molecular representations (e.g., mol2vec), and was consequently selected as the primary model for generating the final candidate list.
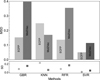 |
Fig. 3 MSD of prediction results for the four regression models (GBR, KNN, RFR, and SVR) evaluated with two molecular representations: mol2vec and ECFP (including charge information). Bottom: SD, indicating the stability of the predictions. |
2.4 Quantum chemical calculations
To support future astronomical observations, quantum chemical calculations were performed to obtain optimized geometries for all 1133 candidate molecules and compute key physical parameters, including formation energies, dipole moments, rotational constants, vibrational frequencies, and infrared spectra. These calculations are based on density functional theory (DFT) at the B3LYP/6-311+G* level using the Gaussian 16 (Frisch et al. 2016; Mardirossian & Head-Gordon 2017; Liao et al. 2023a,b; Lu et al. 2021). Extensive benchmark studies have shown that B3LYP yields reliable equilibrium geometries for small- to medium-sized organic molecules, leading to rotational constants that typically deviate by no more than 1–2% from higher-level ab initio methods or experimental measurements (Thimmakondu & Karton 2023). To validate our computational approach, the calculated properties of randomly selected molecules were compared against reference data from the QM9 database. Good agreement was observed for quantities including rotational constants, dipole moments, and zero-point vibrational energies (ZPVEs), as detailed in Supplementary Information (see Data Availability section).
3 Results and discussion
3.1 Candidate molecules
Using the ECFP-based similarity search method described in Section 2.2, we identified 1,133 distinct candidate molecules. To visualize their overall distribution in chemical space, we applied UMAP to the molecular fingerprints, as shown in Figure 4. The majority of candidate molecules cluster closely with the detected species, indicating that our search effectively captures the dominant structural motifs of known molecules in IRC+10216.
A small subset of candidates appears as outliers with systematic structural features. The top-left outliers are ring-containing molecules (e.g., C5H10SN), potentially reflecting lower thermodynamic stability or observational biases toward simpler species. In the lower portion of the plot, a trail of linear carbon-chain candidates (e.g., C4N) is observed, separated from the main cluster despite similar structures being commonly detected. The central cluster, enriched in both detected and structurally similar candidate molecules, aligns with observational trends favoring small, low-weight species in IRC+10216. The presence of outliers highlights the influence of molecular topology on descriptor-based similarity and suggests that incorporating stability criteria or domain-specific fingerprints could improve the identification of exotic interstellar species.
To assess the validity of our similarity search, we compared the similarity between a candidate and the detected molecules (intergroup similarity) with the similarity among the detected molecules themselves, excluding self-comparisons (intragroup similarity). The results, shown in Figure 5, are presented for species across different charge states. In all cases, the detected molecules exhibit high structural similarity, justifying the use of structural similarity as a basis for searching candidate species. Intergroup similarity is slightly lower but still comparable, confirming that the candidate molecules are structurally related to – though not identical with – the detected species. These observations demonstrate the reliability of our approach and reflect meaningful structural relationships within the chemical space of molecules in the CSE of IRC+10216.
In Figure 5, molecular similarity clearly depends on both size and charge. Smaller or neutral molecules, with simpler structures and fewer atoms, are more likely to share common substructures or functional groups, resulting in higher similarity. In contrast, larger molecules and charged species often exhibit more complex branching or adopt different conformations to accommodate the charge, which reduces structural overlap and lowers similarity. This result indicates that molecular size and charge are key factors influencing structural similarity and should be taken into account when screening candidate molecules.
Figure 6 provides a statistical overview of the 1133 candidate molecules identified in this study, illustrating their charge states, structural types, compound classes, and functional group compositions. The charge-state distribution (Panel a) shows that the vast majority of candidates (88.6%) are neutral, while only a small fraction are ionic – comprising cations (5.8%) and anions (5.6%). This dominance of neutral species is consistent with the chemical environment of IRC+10216, where photodissociation and ion-molecule reactions are counterbalanced by efficient recombination processes, resulting in a predominantly neutral chemistry. The small but notable fraction of ionic species suggests that the search method successfully captures reactive intermediates and charged precursors that could play key roles in molecular formation within the CSE.
The candidate set shows a nearly even structural split between the linear (50.1%) and cyclic (49.9%) molecules (Panel b). In contrast, the inner ring of known, detected molecules is dominated by linear species, with cyclic compounds representing only a minor fraction. This discrepancy likely reflects the comparatively rich representation of ring-containing compounds in the reference dataset used for the similarity-based search, which may bias the candidate pool toward cyclic structures. Nevertheless, the coexistence of both linear and cyclic forms is chemically significant: many cyclic molecules can form from linear precursors via intramolecular cyclization or radical-driven closure reactions. Their shared substructures and functional motifs suggest an evolutionary link between the two families in the carbon-rich envelope of IRC + 10216, where unsaturated carbon chains can rearrange into ring systems under favorable energetic or catalytic conditions.
The composition by compound class (Panel c) is dominated by oxygenated organics (54.3%), followed by nitrogenated organics (33.0%), hydrocarbons (9.4%), and others (3.4%). The high proportion of O-bearing molecules is notable given the carbon-rich nature of IRC +10216 (C/O > 1), where classical equilibrium chemistry predicts oxygen to be largely locked into CO. This prevalence highlights the importance of nonequilibrium processes. In the inner wind, shock-induced chemistry can dissociate CO (e.g., CO + H → C + OH), releasing oxygen that subsequently forms water and organic species (Cherchneff 2011; Agúndez & Cernicharo 2006). Additionally, in the outer envelope, interstellar UV photodissociation breaks the CO reservoir, supplying atomic oxygen for the synthesis of molecules such as formaldehyde (Agúndez & Cernicharo 2006; Decin et al. 2010). Thus, the O-bearing candidates likely trace these specific active regions rather than a ubiquitous equilibrium chemistry.
Functional-group analysis (Panel d) further details the structural trends: nitrile groups (−C≡N) are the most common (33.0%), followed by alkyne (−C≡C−, 25.0%) and alkene (−C=C−, 12.4%) functionalities. These unsaturated groups are characteristic of the stable carbon-rich molecular backbone. The remaining 29.7% of species contain a mix of hydroxyl, amine, carboxylic acid, and other groups, consistent with secondary oxidation and nitrogenation pathways driven by the nonequilibrium processes described above.
It is important to recognize, however, that structural similarity alone does not guarantee astrochemical survival. The strong physical gradients within the IRC+10216 envelope require evaluation from a dynamical perspective. The envelope is governed by three distinct chemical regimes: a thermodynamic equilibrium zone near the photosphere, a shock-affected inner wind, and a photochemistry-dominated outer envelope (Agúndez & Cernicharo 2006; Agúndez et al. 2011; Millar 2008). Accordingly, we classified the candidates into three feasibility tiers:
High-confidence candidates: the model predicts an extensive family of linear carbon chains and cyanopolyynes, consistent with the chemistry of the cold outer envelope (R ≈ 1016–1017 cm). Here, photodissociation products (e.g., C2H and C4H) drive rapid chain growth via neutral-neutral or ion-molecule reactions. As these molecules have well-established gas-phase formation pathways that are not limited by the C/O ratio, they are classified as Tier 1.
Mechanism-dependent candidates: simple oxygen- and nitrogen-bearing organics are classified as Tier 2. While thermodynamic equilibrium in the carbon-rich environment locks oxygen predominantly into CO, nonequilibrium processes, such as shock-induced chemistry in the inner wind or catalytic reactions on dust grains, can facilitate their formation. Consequently, their detection likely depends on specific observational conditions (e.g., high-excitation lines).
Kinetically disfavored species: conversely, highly saturated complex heterocycles or polysubstituted oxygen-rich structures were flagged as “kinetically disfavored”. Without efficient shock-driven or surface-mediated formation mechanisms, these molecules cannot overcome the high reaction barriers present at the low temperatures of the envelope.
A complete list of the 1133 candidate molecules, along with their predicted column densities and other relevant properties, is provided in the supplementary materials (see Data Availability section). Please note that identical formulas may represent distinct isomers (e.g., linear vs. cyclic). The definitive isomer for a given formula must be verified against the optimized molecular geometries provided in the supplementary materials (see Data Availability section).
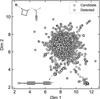 |
Fig. 4 Projection of detected molecules (squares) and candidate molecules (circles) onto a 2D chemical space generated via UMAP of molecular fingerprints. |
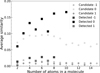 |
Fig. 5 Comparison of average cosine similarities between candidate and detected molecules (intergroup, circles) and among detected molecules themselves (intragroup, squares), shown as a function of atom number and charge state (anions: −1; neutral: 0; cations: 1). The similarity is defined as the cosine similarity between ECFP vectors for pairs of molecules. For each molecule, the similarity to all molecules in the detected molecule set is calculated and averaged; these averages are then grouped and averaged again over molecules with the same number of atoms. |
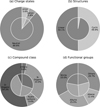 |
Fig. 6 Statistical analysis of the candidate (outer rings) and detected (inner rings) molecules. (a) Charge states: distribution of molecular charge states. (b) Structures: classification of molecular structural types. (c) Compound class: grouping of molecules by chemical type. (d) Functional groups: distribution based on all functional groups identified in each molecule. |
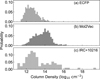 |
Fig. 7 Probability distributions of predicted column densities for candidate molecules using the SVR model with ECFP, charge information (red), and mol2vec embeddings (blue), compared with the observed column densities of detected molecules in IRC+10216 (gray). |
3.2 Implications and selection
Using the selected SVR model, we predicted the column densities of the candidate molecules based on the dataset of all detected species. The resulting distributions are shown in Figure 7. The predicted column densities exhibit distinct patterns depending on the molecular representation employed. The ECFP-based model (Panel a) produces a relatively narrow distribution centered around log10 N ~ 12.5, indicating that most candidate molecules are predicted to have moderate abundances comparable to the typical range of detected interstellar species (Panel c). In contrast, the mol2vec-based model (Panel b) yields a broader and slightly higher distribution extending beyond log10 N > 14, suggesting that this embedding captures additional structural or physicochemical features that contribute to higher predicted column densities. However, the wider spread observed in the mol2vec results may also indicate that this representation better reflects the diversity of chemical environments and molecular complexity within the carbon-rich CSE.
To produce a shortlist of promising molecules from the 1133 candidates, we cross-referenced our candidate species with the CDMS and JPL catalogs in Splatalogue2, retaining only transitions within standard ALMA bands 1–10. Sixty-two molecules were present in both the candidate list and the catalogs. From these, we selected 30 species by calculating their line intensities at 37.5 K using the species-specific predicted column densities.
The line-intensity distribution in Figure 8 illustrates how both the predicted column densities and molecular spectroscopic properties shape the detectability of the candidate species across ALMA bands 1–10. Several molecules, such as HCS+, l-C3H+, CNCHO, HOCN, H2CN, and HCO, show strong, isolated transitions in the 200–600 GHz range, indicating favorable combinations of abundance and dipole-allowed line strength. Others, including CH3NH2 and HCCCHO, display numerous but weaker transitions, where line confusion rather than sensitivity may be the limiting factor. The figure also highlights species with strong high-frequency lines extending into bands 9-10, although these require more stringent observing conditions. Details of the transition computation are provided in the Supplementary Information (see Data Availability section).
Table 2 presents the 30 highest-priority molecular candidates for detection in the CSE of IRC+10216, ranked by their predicted column density. This ranking results from the methodology illustrated in Figure 8, which prioritizes transitions from abundant species over intrinsically strong lines from rarer molecules, thereby optimizing the likelihood of successful detection. The table provides essential molecular parameters, including the electric dipole moment (μ) and Einstein A coefficient (log A) sourced from Splatalogue, as well as the column density (log N), which collectively determine line intensity. Notably, several top-ranked molecules, such as NH, PH2, and SiH, possess very high predicted column densities (log N > 14), but their detectability is moderated by other factors; for instance, SiH has an exceptionally low dipole moment (0.08 D), severely limiting its line strength despite its abundance.
The list reveals a chemically diverse set of candidates, including small radicals (e.g., HCO and SO), complex organic molecules (e.g., CH3OCH3 and CH3NH2), and reactive intermediates (e.g., HCS+ and l-C3H+). While having somewhat lower column densities, molecules such as HNCO, HCNS, and HCCCHO benefit from larger μ and favorable A, placing them within the detectable range as indicated in the frequency distribution analysis. To evaluate the detectability of candidate molecules, we conducted a molecular line search for HS2, one of the molecules from our shortened candidate list, using archival ALMA data as described in the Supplementary Information (see Data Availability section). However, no convincing evidence for its detection was found.
To facilitate future detections of the 1,071 candidate molecules absent from current CDMS and JPL databases, we performed DFT calculations to predict key physicochemical properties for both the candidate and detected molecules. The computed properties include optimized geometries, formation energies, dipole moments, ZPVEs, rotational constants, and harmonic vibrational spectra. These data are provided in the Supplementary Information (see Data Availability section).
Figure 9 presents the statistical distributions of these properties for the candidate molecules compared with those of the detected species. It shows that the detected molecules generally occupy narrower regions of property space compared to the much broader distributions of the candidates.
Panel a shows the formation energy distribution, revealing a clear bias toward stability. Detected molecules cluster in the low-energy region, while candidates extend into significantly more stable domains. Panel b shows the dipole moment distribution: detected species lie mainly between 1 and 5 D, whereas candidates extend up to 12 D. Since the integrated line intensity scales with the dipole moment squared, candidates with large dipole moments can remain detectable even at abundances 1-2 orders of magnitude below current limits.
Panels d–f display the principal moments of inertia. Many candidates have large moments, corresponding to small rotational constants. Under typical excitation conditions, their strongest rotational transitions (low-J lines) therefore lie at substantially lower frequencies. Current surveys of IRC+10216 focus heavily on frequencies >200 GHz (e.g., ALMA band 6). Our analysis suggests that the optimal spectral window for detecting this reservoir of heavier molecules likely falls in lower-frequency bands. Hence, the non-detection of these species may reflect the observational frequency coverage rather than their absence in the source.
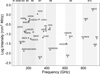 |
Fig. 8 Distribution of peak emission frequencies for the top 30 priority molecules. For each species, the data point marks the frequency of its strongest transition (peak intensity) calculated at an excitation temperature of 37.5 K. The vertical axis represents the calculated intensity, while the colored regions (labeled B1-B10) illustrate the frequency coverage of ALMA bands 1 through 10. |
Top 30 candidate species, sorted by predicted column density.
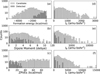 |
Fig. 9 Distributions of molecular properties computed from DFT calculations for candidate (blue) and detected (orange) species. (a) Formation energy, (b) dipole moment, (c) ZPVEs, and (d–f) principal moments of inertia (IA, IB, and IC). All vertical axes are logarithmic to show the wide range of molecular counts. |
4 Conclusion
In this study, we used a cheminformatics-based framework to systematically predict and evaluate the molecular composition of the carbon-rich CSE of IRC+10216. Integrating structural similarity searches with ML-based column density models, we identified 1133 candidate molecules and analyzed their physicochemical properties via quantum chemical calculations. From this candidate set, we prioritized 30 molecules based on predicted column densities and spectroscopic line strengths across ALMA bands, providing a targeted list for future observational studies.
However, it is important to distinguish between the statistical column densities predicted here and the abundances derived from kinetic astrochemical models. While the present framework establishes a correlation between molecular structure and observed column density, it does not explicitly incorporate chemical formation pathways, reaction barriers, or destruction processes. Therefore, these predictions reflect a statistical likelihood of detectability given current observational constraints, rather than a physically derived concentration. Accordingly, the identified candidates should be viewed as an observationally motivated search list whose chemical plausibility must be assessed through detailed reaction network modeling and spectral surveys. These results are not intended to fully represent interstellar chemical evolution, nor do they guarantee kinetically realistic abundances. Future work should therefore integrate astrochemical reaction networks and kinetic constraints into the predictive pipeline, combining structural, thermodynamic, and kinetic information to establish a more chemically grounded framework for molecular discovery.
Data availability
The Supplementary Information and datasets for this work are provided in three parts via Zenodo at DOI:10.5281/zenodo.18044751:
A summary of candidate and detected molecular species, along with key results from DFT calculations that underpin the subsequent analysis, provided in a .xlsx file.
A supplementary document outlining the methodological criteria, ranking principles, reliability analyses, and ALMA molecular line search, is provided in a .pdf file.
The DFT calculation results, including optimized molecular structures and derived physical properties, are documented in the complete set of raw Gaussian output files, which are provided in a .zip file.
The source ML code are available on Git repository: MLColumnDensity.
Acknowledgements
The authors acknowledge financial support from the National Natural Science Foundation of China (grant no. 12463005 and 11964002). This work was also supported by the Guangxi Talent Programme (Highland of Innovation Talents).
References
- Abplanalp, M. J., Gozem, S., Krylov, A. I., et al. 2016, PNAS, 113, 7727 [Google Scholar]
- Agúndez, M., & Cernicharo, J. 2006, ApJ, 650, 374 [CrossRef] [Google Scholar]
- Agúndez, M., Cernicharo, J., & Guélin, M. 2010, ApJ, 724, L133 [CrossRef] [Google Scholar]
- Agúndez, M., Cernicharo, J., Waters, L. B. F. M., et al. 2011, A&A, 533, L6 [NASA ADS] [CrossRef] [EDP Sciences] [Google Scholar]
- Agúndez, M., Cernicharo, J., & Guélin, M. 2014, A&A, 570, A45 [Google Scholar]
- Cernicharo, J., Gottlieb, C. A., Guelin, M., et al. 1991, ApJ, 368, L39 [NASA ADS] [CrossRef] [Google Scholar]
- Cernicharo, J., Guélin, M., & Kahane, C. 2000, A&AS, 142, 181 [NASA ADS] [Google Scholar]
- Cernicharo, J., Cabezas, C., Pardo, J. R., et al. 2023, A&A, 672, L13 [NASA ADS] [CrossRef] [EDP Sciences] [Google Scholar]
- Cherchneff, I. 2011, A&A, 526, L11 [NASA ADS] [CrossRef] [EDP Sciences] [Google Scholar]
- Cherchneff, I. 2012, A&A, 545, A12 [NASA ADS] [CrossRef] [EDP Sciences] [Google Scholar]
- Decin, L., Agúndez, M., Barlow, M. J., et al. 2010, Nature, 467, 64 [NASA ADS] [CrossRef] [Google Scholar]
- Ferrero, S., Ceccarelli, C., Ugliengo, P., Sodupe, M., & Rimola, A. 2023, ApJ, 951, 150 [CrossRef] [Google Scholar]
- Frisch, M. J., Trucks, G. W., Schlegel, H. B., et al. 2016, Gaussian 16 Revision C.01 [Google Scholar]
- Groenewegen, M. A. T., Barlow, M. J., Blommaert, J. A. D. L., et al. 2012, A&A, 543, L8 [NASA ADS] [CrossRef] [EDP Sciences] [Google Scholar]
- Herbst, E., & van Dishoeck, E. F. 2009, ARA&A, 47, 427 [Google Scholar]
- Jaeger, S., Fulle, S., & Turk, S. 2018, J. Chem. Inf. Model., 58, 27 [Google Scholar]
- Kim, S., Chen, J., Cheng, T., et al. 2021, NucAR, 49, D1388 [Google Scholar]
- Kwan, J., & Hill, F. 1977, ApJ, 215, 781 [Google Scholar]
- Kwan, J., & Linke, R. A. 1982, ApJ, 254, 587 [Google Scholar]
- Lee, K. L. K., Patterson, J., Burkhardt, A. M., et al. 2021, ApJ, 917, L6 [NASA ADS] [CrossRef] [Google Scholar]
- Liao, Q., Wang, J., Xie, P., Liang, E., & Wang, Z. 2023a, RAA, 23, 122001 [Google Scholar]
- Liao, Q., Xie, P., & Wang, Z. 2023b, Phys. Chem. Chem. Phys., 25, 28829 [Google Scholar]
- Lu, S., Meng, Z., Xie, P., Liang, E., & Wang, Z. 2021, A&A, 656, A84 [NASA ADS] [CrossRef] [EDP Sciences] [Google Scholar]
- Mardirossian, N., & Head-Gordon, M. 2017, MolPh, 115, 2315 [Google Scholar]
- Martin, P. G., & Rogers, C. 1987, ApJ, 322, 374 [Google Scholar]
- McGuire, B. A. 2022, ApJS, 259, 30 [NASA ADS] [CrossRef] [Google Scholar]
- McInnes, L., Healy, J., & Melville, J. 2018, arXiv e-prints [arXiv:1802.03426] [Google Scholar]
- Millar, T. J. 2008, Ap&SS, 313, 223 [Google Scholar]
- Morgan, H. L. 1965, J. Chem. Doc., 5, 107 [Google Scholar]
- Pardo, J. R., Cernicharo, J., Tercero, B., et al. 2022, A&A, 658, A39 [NASA ADS] [CrossRef] [EDP Sciences] [Google Scholar]
- Pulliam, R. L., Edwards, J. L., & Ziurys, L. M. 2011, ApJ, 743, 36 [NASA ADS] [CrossRef] [Google Scholar]
- Ramakrishnan, R., Dral, P. O., Rupp, M., & von Lilienfeld, O. A. 2014, Sci. Data, 1, 140022 [Google Scholar]
- Rogers, D., & Hahn, M. 2010, J. Chem. Inf. Model., 50, 742 [Google Scholar]
- Ruddigkeit, L., Van Deursen, R., Blum, L. C., & Reymond, J.-L. 2012, J. Chem. Inf. Model., 52, 2864 [Google Scholar]
- Scolati, H. N., Remijan, A. J., Herbst, E., McGuire, B. A., & Lee, K. L. K. 2023, ApJ, 959, 108 [Google Scholar]
- Sterling, T., & Irwin, J. J. 2015, J. Chem. Inf. Model., 55, 2324 [Google Scholar]
- Tenenbaum, E. D., Apponi, A. J., Ziurys, L. M., et al. 2006, ApJ, 649, L17 [CrossRef] [Google Scholar]
- Tenenbaum, E. D., Dodd, J. L., Milam, S. N., Woolf, N. J., & Ziurys, L. M. 2010, ApJS, 190, 348 [NASA ADS] [CrossRef] [Google Scholar]
- Thimmakondu, V. S., & Karton, A. 2023, Molecules, 28, 6537 [Google Scholar]
- Tuo, J., Li, X., Sun, J., et al. 2024, ApJS, 271, 45 [Google Scholar]
- Van de Sande, M., & Millar, T. J. 2022, IAU Symp., 366, 265 [Google Scholar]
- Wang, Y., Xiao, J., Suzek, T. O., et al. 2012, Nucleic Acids Res., 40, D400 [Google Scholar]
- Wilson, R. W., Solomon, P. M., Penzias, A. A., & Jefferts, K. B. 1971, ApJ, 169, L35 [Google Scholar]
- Ziurys, L. M. 2006, PNAS, 103, 12274 [CrossRef] [Google Scholar]
- Ziurys, L. M., Savage, C., Highberger, J. L., et al. 2002, ApJ, 564, L45 [NASA ADS] [CrossRef] [Google Scholar]
- Zuckerman, B., Dyck, H. M., & Claussen, M. J. 1986, ApJ, 304, 401 [Google Scholar]
All Tables
All Figures
|
Fig. 1 Schematic of the workflow of this study. |
| In the text | |
|
Fig. 2 UMAP visualization of the 106 detected molecules in chemical space. The colored circles represent different element categories, while their sizes indicate molecular column density. |
| In the text | |
|
Fig. 3 MSD of prediction results for the four regression models (GBR, KNN, RFR, and SVR) evaluated with two molecular representations: mol2vec and ECFP (including charge information). Bottom: SD, indicating the stability of the predictions. |
| In the text | |
|
Fig. 4 Projection of detected molecules (squares) and candidate molecules (circles) onto a 2D chemical space generated via UMAP of molecular fingerprints. |
| In the text | |
|
Fig. 5 Comparison of average cosine similarities between candidate and detected molecules (intergroup, circles) and among detected molecules themselves (intragroup, squares), shown as a function of atom number and charge state (anions: −1; neutral: 0; cations: 1). The similarity is defined as the cosine similarity between ECFP vectors for pairs of molecules. For each molecule, the similarity to all molecules in the detected molecule set is calculated and averaged; these averages are then grouped and averaged again over molecules with the same number of atoms. |
| In the text | |
|
Fig. 6 Statistical analysis of the candidate (outer rings) and detected (inner rings) molecules. (a) Charge states: distribution of molecular charge states. (b) Structures: classification of molecular structural types. (c) Compound class: grouping of molecules by chemical type. (d) Functional groups: distribution based on all functional groups identified in each molecule. |
| In the text | |
|
Fig. 7 Probability distributions of predicted column densities for candidate molecules using the SVR model with ECFP, charge information (red), and mol2vec embeddings (blue), compared with the observed column densities of detected molecules in IRC+10216 (gray). |
| In the text | |
|
Fig. 8 Distribution of peak emission frequencies for the top 30 priority molecules. For each species, the data point marks the frequency of its strongest transition (peak intensity) calculated at an excitation temperature of 37.5 K. The vertical axis represents the calculated intensity, while the colored regions (labeled B1-B10) illustrate the frequency coverage of ALMA bands 1 through 10. |
| In the text | |
|
Fig. 9 Distributions of molecular properties computed from DFT calculations for candidate (blue) and detected (orange) species. (a) Formation energy, (b) dipole moment, (c) ZPVEs, and (d–f) principal moments of inertia (IA, IB, and IC). All vertical axes are logarithmic to show the wide range of molecular counts. |
| In the text | |
Current usage metrics show cumulative count of Article Views (full-text article views including HTML views, PDF and ePub downloads, according to the available data) and Abstracts Views on Vision4Press platform.
Data correspond to usage on the plateform after 2015. The current usage metrics is available 48-96 hours after online publication and is updated daily on week days.
Initial download of the metrics may take a while.