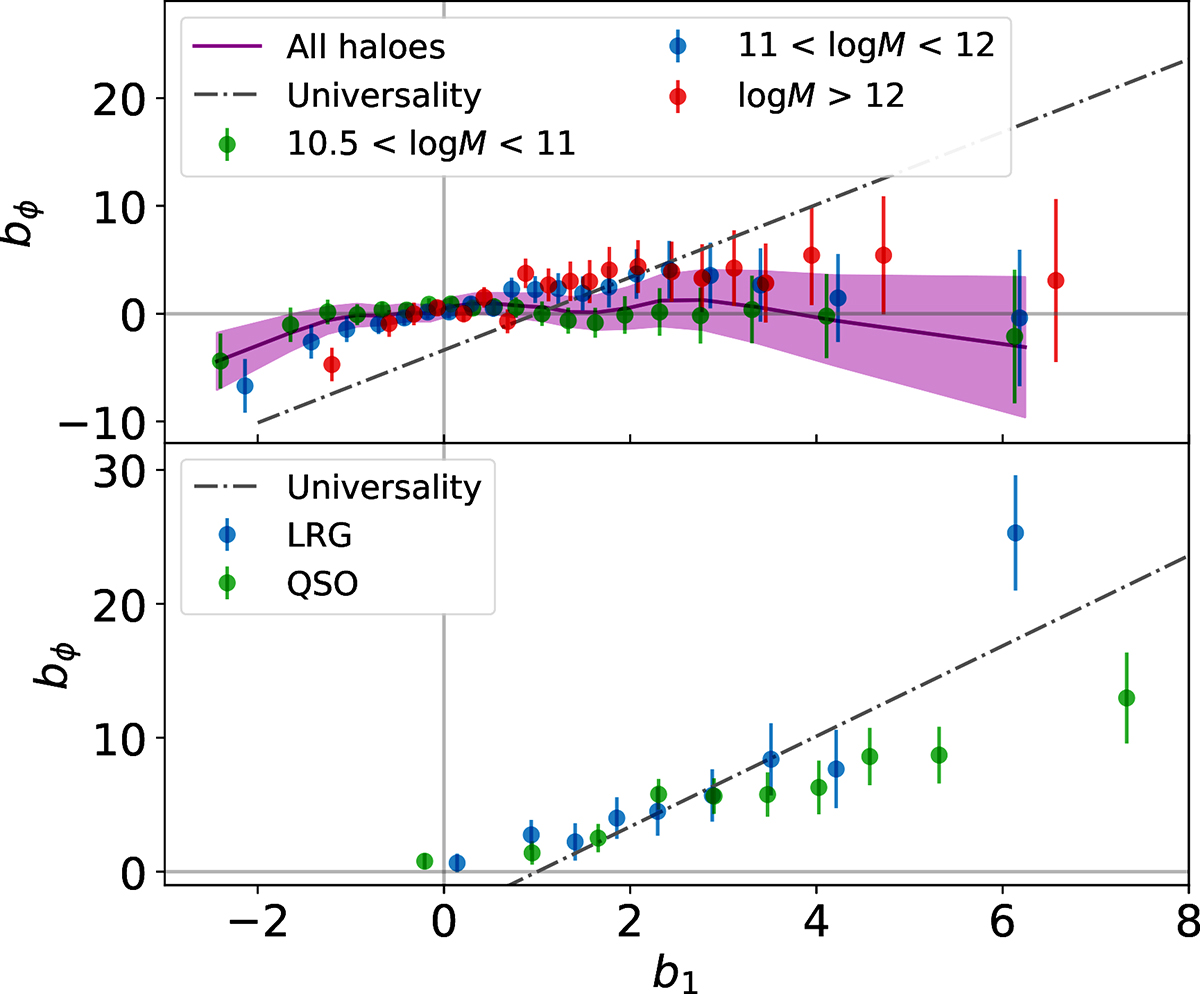
Fig. 3.
Download original image
PNG-response (bϕ) as a function of the measured bias (b1) for the tracers binned in their local overdensity. Top: Results for all haloes (purple band) together. The black dot-dashed line shows the universality relation. We find the PNG response well below the universality relation and compatible with no response (bϕ ∼ 0). We also show (as markers with errorbars) the results using mass bins as parent catalogues. Bottom: Same results, but for the LRGs and QSOs from PNG-UNITsim-XL.
Current usage metrics show cumulative count of Article Views (full-text article views including HTML views, PDF and ePub downloads, according to the available data) and Abstracts Views on Vision4Press platform.
Data correspond to usage on the plateform after 2015. The current usage metrics is available 48-96 hours after online publication and is updated daily on week days.
Initial download of the metrics may take a while.