| Issue |
A&A
Volume 707, March 2026
|
|
|---|---|---|
| Article Number | L15 | |
| Number of page(s) | 5 | |
| Section | Letters to the Editor | |
| DOI | https://doi.org/10.1051/0004-6361/202558825 | |
| Published online | 17 March 2026 | |
Unclustered tracers remain unclustered
The lack of primordial non-Gaussianity response of bias-zero tracers
1
Centro de Investigaciones Energéticas, Medioambientales y Tecnológicas (CIEMAT), Madrid, Spain
2
Departamento de Física Teórica, Universidad Autónoma de Madrid, 28049 Madrid, Spain
3
Department of Astrophysics, University of Vienna, Türkenschanzstrasse 17, 1180 Vienna, Austria
4
Centro de Investigación Avanzada en Física Fundamental (CIAFF), Universidad Autónoma de Madrid, ES-28049 Madrid, Spain
5
Instituto de Física, Universidad Nacional Autónoma de México, Apdo. Postal 20-364 Ciudad de México, Mexico
★ Corresponding author: This email address is being protected from spambots. You need JavaScript enabled to view it.
Received:
30
December
2025
Accepted:
14
February
2026
Abstract
Constraining primordial non-Gaussianities (PNGs) is one of the main goals of new-generation large-scale galaxy surveys. It had been proposed that unclustered tracers (with bias b1 = 0) could be optimal for PNG studies, and that these could be found by selecting galaxies in bins of their local density. We tested this hypothesis in state-of-the-art simulations from the PNG-UNITsim suite with local fNL = 100 and fNL = −20. We considered different parent tracer catalogues: all haloes together, haloes in broad mass bins, and halo occupation distribution (HOD) models for luminous red galaxies (LRGs) and quasars (QSOs). We then classify these tracers by their local density (δt, R) and measure the linear bias (b1) and PNG response (bϕ). Most δt, R bins show a PNG response compatible with bϕ = 0 for all haloes or the low-mass bin (log M < 11). For high-mass haloes (log M> 12), QSO or LRG, we recover a trend closer to the universality relation (bϕ = 2δcrit(b1 − 1)) for b1 > 1, but the bϕ(b1) curve flattens to 0 below |b1|< 1. Hence, we find bϕ ≈ 0 for all bias-zero tracers considered. The complex δt, R-based selection causes their clustering to strongly deviate from simple assumptions, namely the universality relation and Poisson shot noise, hindering their capability to constrain PNGs.
Key words: early Universe / large-scale structure of Universe / inflation
© The Authors 2026
 Open Access article, published by EDP Sciences, under the terms of the Creative Commons Attribution License (https://creativecommons.org/licenses/by/4.0), which permits unrestricted use, distribution, and reproduction in any medium, provided the original work is properly cited.
This article is published in open access under the Subscribe to Open model. This email address is being protected from spambots. You need JavaScript enabled to view it. to support open access publication.
1. Introduction
Cosmic inflation–a phase of accelerated expansion during the first moments of the Universe–was postulated as a solution to some of the problems of the Hot Big Bang theory associated with the initial conditions (ICs; Guth 1981; Linde 1982). It also explains the origin of the inhomogeneities giving rise to the large-scale structure of the Universe (LSS). Although inflation is assumed to be part of the standard model in most modern cosmological analyses, the exact physics driving it remains unknown, as a wide variety of physical models can produce inflation.
One observable that discriminates among families of models is primordial non-Gaussianity (PNG). We focus on the simplest PNG, local-fNL (Komatsu & Spergel 2001), which introduces quadratic expansion of a Gaussian gravitational field, ϕG,
 (1)
(1)
where ⟨ ⋅ ⟩ represents a spatial average. Typically, this parameter is predicted to be fNL > 𝒪(1) for inflation driven by multiple fields (Byrnes & Choi 2010; Alvarez et al. 2014).
Although the primary effect of local-fNL is to generate a primordial bispectrum, the non-linear evolution of the LSS allows us to study PNG through two-point statistics. Galaxies (g) or haloes (h) are biased tracers (t) of the matter (m) density. At large scales, this is given by a linear relation of overdensity (δ):
 (2)
(2)
For Gaussian initial conditions, the large-scale bias is simply a constant, b1, the linear bias. However, when including PNG, the bias becomes scale-dependent (Dalal et al. 2008; Slosar et al. 2008; Matarrese & Verde 2008):
 (3)
(3)
Here bϕ is a bias parameter associated with the gravitational field, ϕ, related to the overdensity field via
 (4)
(4)
where D(z) is the growth factor normalised to (1 + z)−1 in the radiation era, T(k) is the transfer function (with T(k → 0)→1), ΩM is the current matter density, H0 the Hubble constant, and c the speed of light. The PNG universality relation is given by (Dalal et al. 2008)
 (5)
(5)
where δcrit is the critical density for spherical collapse (1.686).
Many galaxy surveys, such as DESI, Euclid, or SPHEREx, aim to constrain fNL with Eq. (3). Identifying observables that maximise the PNG signal would be highly valuable in order to better understand inflation. In that context, Castorina et al. (2018) postulated that unclustered (b1 = 0) tracers would be optimal in a regime with negligible shot noise (Pshot), with an error given by
 (6)
(6)
with Pmm(k) the matter power spectrum.
The way to find bias-zero tracers proposed in that work is by binning tracers according to their local density. They showed that unclustered tracers can be found in dark matter halo catalogues from cosmological N-body simulations with Gaussian ICs.
The goal of this letter is to verify or disprove the feasibility of using bias-zero tracers selected by local overdensity to set strong constraints on PNGs. For that, we use state-of-the-art N-body simulations with PNGs from the PNG-UNITsim suites (Adame et al. 2024).
2. Simulations
The PNG-UNIT simulation is an N-Body simulation (Adame et al. 2024), which is a twin of one of the UNITsims (Chuang et al. 2019), with the same size (L = 1 h−1 Gpc) and resolution (Npart = 40963, mp = 1.2 × 10⁹ h−1 M⊙), and that uses the same white noise for the ICs and ΛCDM parameters (based on Planck Collaboration XIII 2016); the only difference is the inclusion of a PNG of local-fNL = 100. This makes it one of the PNG simulations with the highest mass resolution and one of the largest in terms of particles. For this work we used the z = 1 ROCKSTAR (Behroozi et al. 2013) halo catalogues. These simulations are publicly available1.
The PNG-UNITsim-XL we used here is a L = 3 h−1 Gpc simulation with N = 40963 particles and initial conditions with fNL = −20, which is a twin of a fNL = 0 UNITsim-XL simulation. These simulations are fully described in Adame et al. (in prep.). Both these simulations have been populated with a halo occupation distribution (HOD) model (Avila et al. 2020) matching the galaxy bias of DESI’s Luminous Red Galaxies (LRG, using a snapshot at z = 0.74) and quasars (QSO, using z = 1.83). The HOD is first set to have a maximum of ∼1 for central galaxies and is later downsampled (by a factor of ∼2 and ∼40 for LRGs and QSOs, respectively) to match the number density of DESI. In this work we show the results for the full density samples, while we checked that results are consistent, but noisier, for the realistic-density sample.
3. Methodology
The potential of bias-zero tracers is illustrated in Fig. 1: an unclustered tracer in a Gaussian universe (b1 = 0, black line) would cluster in PNG universes (green line) with a 1/k2 pattern. In this section we describe the methodology to test that.
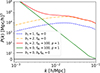 |
Fig. 1. Theoretical auto-power spectra for matter (b = 1, fNL = 0), a biased tracer in a Gaussian Universe (bg = 2, fNL = 0), a biased universal tracer with PNG (bg = 2, fNL = 100, p = 1), an unclustered but universal tracer (bg = 0, fNL = 100, p = 1), and an unclustered and non-PNG-responsive tracer (bg = 0, bϕ = 0). |
3.1. Density classification
Unclustered tracers are expected to be found in regions that are neither very dense nor very empty. We follow the approach of Castorina et al. (2018) and classify tracers according to their density in spheres of radius R, δt, R, using by default R = 8 h−1 Mpc. For this purpose, we use the SCIPY function CKDTREE. We considered different options for the parent samples:
-
All haloes in the PNG-UNITsims above 20 particles;
-
PNG-UNItsim haloes split into three mass bins: 10.5 < log M < 11, 11 < log M < 12, and log M > 12;
-
LRGs and QSOs from a HOD applied to PNG-UNITsim-XL.
For this paper we focused on equal-number δt, R bins, starting from the parent catalogues. We used 20 bins for haloes and 10 bins for galaxies. For better comparison with Castorina et al. (2018), we also reproduced their method based on only splitting the parent sample into two local density subsamples. We then kept the lower one:  . As we vary the parameter
  , we measure the linear bias of the sample, until we find b1 ≈ 0.
3.2. Parameter fitting
For each subsample of interest, we compute the tracer auto-power spectrum Ptt(k) and the tracer-matter cross-power spectrum Ptm(k) with NBODYKIT (Hand et al. 2018). We additionally compute the matter power spectrum Pmm(k), so that we can estimate the bias parameters by fitting the equations
 (7)
(7)
where we fit the free parameters b1, bϕ, and Asn. Here Asn represents the shot noise deviation from the Poisson prediction (1/n).
We use a Gaussian diagonal covariance (Smith 2009)
![Mathematical equation: $$ \begin{aligned} \begin{array}{l} \sigma _{tt}(k)^2 = \left( P_{tt}(k) + \frac{A_{sn}}{n}\right)^2\cdot \frac{2\ (2\pi )^3}{4\pi \ k^2 \Delta k\ V}\;\; \mathrm{{and}}\\ \sigma _{tm}(k)^2 = \left[ \left( P_{tt}(k) + \frac{A_{sn}}{n}\right) P_{mm}(k) + P_{tm}(k) ^2 \right] \frac{(2\pi )^3}{4\pi \ k^2 \Delta k\ V} , \\ \end{array} \end{aligned} $$](/articles/aa/full_html/2026/03/aa58825-25/aa58825-25-eq10.gif) (8)
(8)
where V = L3 is the volume and Δk is the k-bin width, which we set to the size of the fundamental mode kf = 2π/L.
We fit the parameters using a Markov chain Monte Carlo (MCMC) algorithm with the EMCEE library from the cross-power spectrum up to kmax = 0.08 h Mpc−1. We validate our methodology in Appendix A.
4. Results
4.1. Halo density bins
The linear bias of haloes grows monotonically with their local density δh, R. This is shown for the UNIT simulation (fNL = 0) haloes with at least 20 particles (Mh > 2 × 10¹⁰) in Fig. 2. For this measurement, we fit the linear bias (b1) and shot-noise parameter (Asn), while fixing fNL = 0. Figure 2 also shows the agreement between the results using the auto- and cross-power spectra. These results are in line with Castorina et al. (2018), and allow us to find the b1 ≈ 0 tracers.
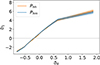 |
Fig. 2. Measured linear halo bias b1 (68% c.l.) as a function of halo overdensity δh, R in spheres of R = 8 h−1 Mpc for the UNIT simulation (fNL = 0). Similar results are found for fNL = 100. |
For the PNG-UNIT simulation (fNL = 100) haloes, we additionally fit for bϕ, while fixing fNL = 100. The b1(δh, R) relation measured from the cross-correlation is nearly identical to the fNL = 0 case. However, for the auto-correlation, the fits near b1 ≈ 0 are more numerically unstable, with b1 absorbing the shot noise. For simplicity, we focus here on the cross-correlation results.
At linear scales, δh = b1δM. Hence, one would expect that we measure something compatible with b1 = 0 whenever δh = 0. However, this is not exactly what we see in Fig. 2, where the curve does not cross {b1 = 0, δh, R = 0}. This arises because R = 8 h−1 Mpc is mildly non-linear; we verified that increasing R does not change our conclusions, while approaching the {b1 = 0, δh, R = 0} crossing.
Another interesting feature is that the best fit for Asn typically ranges in 20 − 40, with Asn = 27 for the bin closest to b1 = 0. Castorina et al. (2018) already showed that these tracers were more stochastic than Poisson, but the factor found here is even higher, which might be due to the increased number density (and reduced baseline shot noise). This contribution of a factor of ∼30 in the increase in shot noise already suggests that using these tracers as optimal for PNG will be challenging, according to Eq. (6). We observe that Asn becomes higher for larger R, suggesting this effect comes from the exclusion of tracers.
We now move to the central idea of the paper using the PNG-UNITsim haloes with fNL = 100. In the top panel of Fig. 3 we represent the fitted bϕ against the linear bias for all haloes when classified in bins of δt, R as explained in Sect. 3.1.
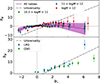 |
Fig. 3. PNG-response (bϕ) as a function of the measured bias (b1) for the tracers binned in their local overdensity. Top: Results for all haloes (purple band) together. The black dot-dashed line shows the universality relation. We find the PNG response well below the universality relation and compatible with no response (bϕ ∼ 0). We also show (as markers with errorbars) the results using mass bins as parent catalogues. Bottom: Same results, but for the LRGs and QSOs from PNG-UNITsim-XL. |
We find that bϕ strongly deviates from the universality relation (Eq. (5)) marked by the dot-dashed line in Fig. 3. Moreover, we find that bϕ is compatible with zero for most of the δh, R bins. In particular, the bins close to b1 = 0 are clearly vanishing.
4.2. Mass and halo density bins
A more realistic scenario is that you have a galaxy sample that is typically associated with a mass range. In Castorina et al. (2018), they test three mass bins as parent catalogues, similar to the three bins used here and defined in Sect. 3.1. We also show the bϕ(b1) results for the mass bins in the top panel of Fig. 3. Remarkably, for the lower mass bin, we find a very flat bϕ(b1)∼0 curve (as in Sect. 4.1). On the other hand, the medium- and high-mass bins show a mild PNG response for |b1|> 1, but are still typically below the universality relation. The excess of shot noise becomes more moderate for mass bins; in increasing order, we find Asn= 13, 7, and 2.
4.3. Galaxies in density bins
We now use a more realistic scenario, where we sample the halo catalogue with an HOD, representing DESI QSOs and LRGs in the PNG-UNITsim-XL simulations. While we show the results for the high-density samples (see Sect. 2), these are consistent with those from the realistic scenario, but less noisy.
The results are shown at the bottom of Fig. 3. In this case, the results follow a trend that is more similar to the universality relation. Nevertheless, the points near b1 = 0 are still very compatible with |bϕ| = 0 and clearly below the universality relation. In this case, the excess of shot noise is more moderated with Asn = 1.26 for LRGs and Asn = 1.21 for QSOs.
4.4. Density splits for all parent catalogues
Finally, we use an approach that is matched to the original Castorina et al. (2018) proposal: splitting each of the parent haloes in just two density bins, according to a  . For each of the parent catalogues, we identify the
  that makes b1 closest to zero, and plot the values of bϕ for each of them in Fig. 4, and compare the results to the equivalent results from the δt, R bins. We find all of these cases to also be compatible with bϕ = 0.
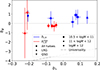 |
Fig. 4. PNG response (bϕ) and linear bias (b1) measurements for the closest case to b1 = 0 for the density bins (blue) and density split (red) samples. We consider different parent catalogues: all haloes, haloes in mass bins, and HODs (Sect. 3.1). For all cases, the PNG response is clearly smaller than predicted by universality (dot-dashed line) and compatible with bϕ = 0. |
5. Discussion and conclusions
In this work we have used state-of-the-art PNG simulations from the PNG-UNITsim suite to evaluate the efficiency of unclustered tracers (b1 = 0) for the study of local-PNGs as postulated by Castorina et al. (2018). We classified a parent tracer catalogue (all haloes, haloes in mass bins, or HOD-based galaxies) by their local density δt, R in spheres of R = 8 h−1 Mpc to measure their linear bias (b1) and the PNG response (bϕ) from the cross-power spectrum of the δt, R-selected tracers and the matter field.
When considering all haloes at once or low-mass haloes (10.5 < log M < 11), this method leads to bϕ(b1)≈0 for all δt, R bins (except below b1 ∼ −1.5). This implies that these tracers will remain unclustered after the inclusion of PNG. More graphically, they will follow the black line in Fig. 1 and not the green line. In the case of the medium-mass and higher mass bins (11 < log M < 12, log M > 12), we recover a slight hint for bϕ ≠ 0, but only for |b1|> 1. When considering a parent sample of LRGs and QSOs from a HOD model, matching the galaxy bias of DESI, we recover a bϕ(b1) curve closer to universality (Eq. (5)) for b1 > 1, but that still flattens to bϕ = 0 for b1 ≈ 0.
In summary, all unclustered tracers (b1 ∼ 0) found here remain unclustered with the inclusion of local-PNGs (Fig. 4), strongly deviating from the universality relation. In addition to the density bins, we also considered splitting the sample into two subsamples given a  , and found qualitatively similar results. We also verified that the results mentioned above are robust to scale-cuts, the usage of auto- and cross-power spectra, and the variation in the smoothing scale R (from 4 to 30 h−1 Mpc). A similar trend is also found in Appendix B when classifying haloes in matter density instead of halo or galaxy density. We note that for bϕ = 0 the Fisher information in fNL (Eq. (6)) will vanish, leaving fNL unconstrained. In addition, we find that these samples tend to have super-Poissonian shot noise, sometimes by a factor of ∼30, also complicating the optimality.
This bϕ(b1 ≈ 0)≈0 relation reduces the effectiveness of constraining PNGs. As an example, if we do a Fisher forecast for the LRGs and QSOs modelled in PNG-UNITsim-XL for the DESI volume and number density, we obtain, respectively, σfNL = 4.1 and σfNL = 3.8. When considering their δh, R bin closest to b1 = 0, even if neglecting shot noise, we obtain respectively, σfNL = 133 and σfNL = 102. Additionally, the bϕ(b1 = 0) = 0 relation would also hinder a multi-tracer analysis, where σ(fNL)−2 ∝ |b1AbϕB − b1BbϕA| (Barreira & Krause 2023).
The lack of a PNG response appears in tension with the results reported by Castorina et al. (2018), where they found a PNG response of up to bϕ ≈ 2.5 for a b1 = 0 tracer from their log M > 12.5 parent catalogue2. This difference could possibly arise because that work used separate-universe simulations (with fNL = 0) to estimate bϕ as a derivative of the number of tracers with respect to the amplitude of primordial fluctuations (As). Whereas the separate-universe approach has been tested in halo mass bins (Biagetti et al. 2017), the selection based on the local halo density inherently brings higher order terms (in density and bias) to the selection that could in turn have cosmology dependence (including As). This possibility is supported by Morawetz et al. (2025) who found that δh, R-selected tracers (from a parent catalogue of log M > 13.5 haloes) have a PNG response that deviates from the separate-universe prediction (see their Fig. 9).
Exploring the PNG signal from alternative methods and samples is a powerful way to maximise the information from current and future missions. This work remarks on the importance of developing in parallel realistic suite of simulations to validate and improve the modelling of these less standard statistics.
Acknowledgments
We thank discussions with E. Paillas, J. L. Bernal, R. Angulo and I. Sevilla. SA has been funded by MCIN/AEI/10.13039/501100011033 and FSE+ (Europe) under project PID2024-156844NA-C22 and the RYC2022-037311-I fellowship. VGP is supported by the CNS2024-154242 grant. Contributions: CM led the analysis and figure making. SA led the conceptual design of the project and writing of the paper. AGA contributed to the analysis and interpretation. AA led a first version of the analysis. AGA, SA and VGP led the simulation construction. JMR constructed the HOD catalogues.
References
- Adame, A. G., Avila, S., Gonzalez-Perez, V., et al. 2024, A&A, 689, A69 [NASA ADS] [CrossRef] [EDP Sciences] [Google Scholar]
- Alvarez, M., Baldauf, T., Bond, J. R., et al. 2014, arXiv e-prints [arXiv:1412.4671] [Google Scholar]
- Avila, S., Gonzalez-Perez, V., Mohammad, F. G., et al. 2020, MNRAS, 499, 5486 [NASA ADS] [CrossRef] [Google Scholar]
- Barreira, A., & Krause, E. 2023, JCAP, 2023, 044 [CrossRef] [Google Scholar]
- Behroozi, P. S., Wechsler, R. H., & Wu, H.-Y. 2013, ApJ, 762, 109 [NASA ADS] [CrossRef] [Google Scholar]
- Biagetti, M., Lazeyras, T., Baldauf, T., Desjacques, V., & Schmidt, F. 2017, MNRAS, 468, 3277 [NASA ADS] [CrossRef] [Google Scholar]
- Byrnes, C. T., & Choi, K.-Y. 2010, Adv. Astron., 2010, 1 [CrossRef] [Google Scholar]
- Castorina, E., Feng, Y., Seljak, U., & Villaescusa-Navarro, F. 2018, Phys. Rev. Lett., 121, 101301 [Google Scholar]
- Chuang, C.-H., Yepes, G., Kitaura, F.-S., et al. 2019, MNRAS, 487, 48 [NASA ADS] [CrossRef] [Google Scholar]
- Dalal, N., Doré, O., Huterer, D., & Shirokov, A. 2008, Phys. Rev., D, 77 [Google Scholar]
- Guth, A. H. 1981, Phys. Rev. D, 23, 347 [Google Scholar]
- Hand, N., Feng, Y., Beutler, F., et al. 2018, AJ, 156, 160 [Google Scholar]
- Komatsu, E., & Spergel, D. N. 2001, Phys. Rev. D, 63, 063002 [NASA ADS] [CrossRef] [Google Scholar]
- Linde, A. D. 1982, Phys. Lett. B, 108, 389 [Google Scholar]
- Matarrese, S., & Verde, L. 2008, ApJ, 677, L77 [NASA ADS] [CrossRef] [Google Scholar]
- Morawetz, J., Paillas, E., & Percival, W. J. 2025, JCAP, 2025, 026 [Google Scholar]
- Planck Collaboration XIII. 2016, A&A, 594, A13 [NASA ADS] [CrossRef] [EDP Sciences] [Google Scholar]
- Slosar, A., Hirata, C., Seljak, U., Ho, S., & Padmanabhan, N. 2008, JCAP, 2008, 031 [CrossRef] [Google Scholar]
- Smith, R. E. 2009, MNRAS, 400, 851 [NASA ADS] [CrossRef] [Google Scholar]
We verified our conclusions remain unchanged for log M > 12.5.
Appendix A: The lack of PNG signal
The flat curve for bϕ(b1) = 0 at the top of Fig. 3 can be somewhat surprising at first. To discard errors in the analysis, we verified that for simple halo-mass bins we recover a bϕ(b1) law which is very close to the universality relation (Eq. 5). In fact, we are able to reproduce the results from Adame et al. (2024) with the analysis tools used for this letter.
Another way to verify the tools used here is to select a bin in mass with bias b1 ∼ 3, and compare it to one of the bins in δh, R with a similar bias value (using all haloes as parent catalogue). This is shown in Fig. A.1, where we observe a very clear PNG effect at low k for the mass bins, whereas we do not observe any PNG response for the density bins.
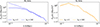 |
Fig. A.1. Power spectrum of a bin with b1 ∼ 3.2 selected by halo mass (Mh, left) and by local halo overdensity (δh, R, right). Whereas the effect of introducing PNG (fNL = 100) has a strong effect on mass-selected bins, the δh, R bins show near identical clustering for fNL = 0 and fNL = 100. |
Appendix B: Classifying by dark matter overdensity
In the main body, we focused on using biased tracers (haloes or galaxies) for the estimation of local density, δt, R. This is motivated by assuming this is what we can do with galaxy surveys. One could think of other ways of estimating local density, such as lensing (either from CMB or from galaxy shear), which will be a more direct probe of the matter field, although typically projected to a 2D sky over a long radial kernel.
For this reason, in this appendix we test an ideal scenario where we would have access to the matter field, δm, R and we can classify haloes according to this density. From the resulting classification, we can compute the linear (b1) and PNG (bϕ) bias as before, obtaining Fig. B.1. We find that there is a strong deviation from universality, with negative bϕ for 0.5 < b1 < 1.5. Nevertheless, what remains unchanged with respect to other tracers is that for b1 = 0 we still find a clear bϕ = 0.
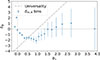 |
Fig. B.1. PNG response bϕ as a function of linear bias b1 for haloes classified as a function of local matter density δm, R using all PNG-UNITsim (fNL = 100) haloes above 20 particles. |
All Figures
|
Fig. 1. Theoretical auto-power spectra for matter (b = 1, fNL = 0), a biased tracer in a Gaussian Universe (bg = 2, fNL = 0), a biased universal tracer with PNG (bg = 2, fNL = 100, p = 1), an unclustered but universal tracer (bg = 0, fNL = 100, p = 1), and an unclustered and non-PNG-responsive tracer (bg = 0, bϕ = 0). |
| In the text | |
|
Fig. 2. Measured linear halo bias b1 (68% c.l.) as a function of halo overdensity δh, R in spheres of R = 8 h−1 Mpc for the UNIT simulation (fNL = 0). Similar results are found for fNL = 100. |
| In the text | |
|
Fig. 3. PNG-response (bϕ) as a function of the measured bias (b1) for the tracers binned in their local overdensity. Top: Results for all haloes (purple band) together. The black dot-dashed line shows the universality relation. We find the PNG response well below the universality relation and compatible with no response (bϕ ∼ 0). We also show (as markers with errorbars) the results using mass bins as parent catalogues. Bottom: Same results, but for the LRGs and QSOs from PNG-UNITsim-XL. |
| In the text | |
|
Fig. 4. PNG response (bϕ) and linear bias (b1) measurements for the closest case to b1 = 0 for the density bins (blue) and density split (red) samples. We consider different parent catalogues: all haloes, haloes in mass bins, and HODs (Sect. 3.1). For all cases, the PNG response is clearly smaller than predicted by universality (dot-dashed line) and compatible with bϕ = 0. |
| In the text | |
|
Fig. A.1. Power spectrum of a bin with b1 ∼ 3.2 selected by halo mass (Mh, left) and by local halo overdensity (δh, R, right). Whereas the effect of introducing PNG (fNL = 100) has a strong effect on mass-selected bins, the δh, R bins show near identical clustering for fNL = 0 and fNL = 100. |
| In the text | |
|
Fig. B.1. PNG response bϕ as a function of linear bias b1 for haloes classified as a function of local matter density δm, R using all PNG-UNITsim (fNL = 100) haloes above 20 particles. |
| In the text | |
Current usage metrics show cumulative count of Article Views (full-text article views including HTML views, PDF and ePub downloads, according to the available data) and Abstracts Views on Vision4Press platform.
Data correspond to usage on the plateform after 2015. The current usage metrics is available 48-96 hours after online publication and is updated daily on week days.
Initial download of the metrics may take a while.