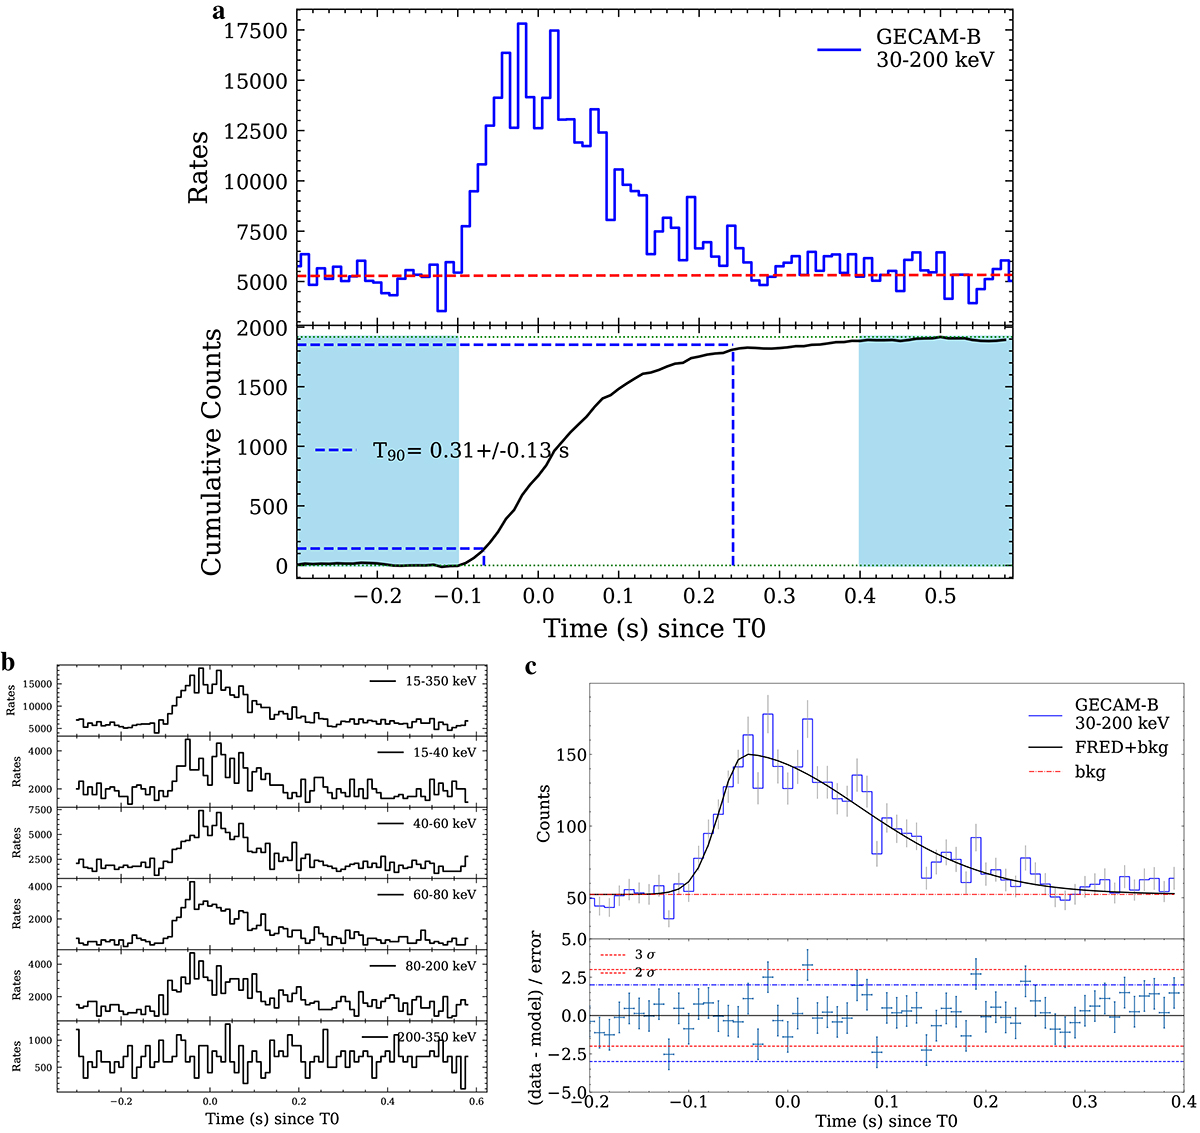
Fig. 1.
Download original image
The light curves and duration of MXB 221120. Panel a: Light curve in 10 ms resolution and duration (T90). The dashed red line in the top panel represents the background level. The blue shadow region in lower panel represents the background range. Panel b: Light curves in different energy bands observed by GECAM-B. Panel c: Light curve fitting with the FRED function. The light curve and FRED profile is plotted in the top panel, and the residuals are plotted in the lower panel.
Current usage metrics show cumulative count of Article Views (full-text article views including HTML views, PDF and ePub downloads, according to the available data) and Abstracts Views on Vision4Press platform.
Data correspond to usage on the plateform after 2015. The current usage metrics is available 48-96 hours after online publication and is updated daily on week days.
Initial download of the metrics may take a while.