| Issue |
A&A
Volume 707, March 2026
|
|
|---|---|---|
| Article Number | A289 | |
| Number of page(s) | 9 | |
| Section | Astrophysical processes | |
| DOI | https://doi.org/10.1051/0004-6361/202658841 | |
| Published online | 11 March 2026 | |
GECAM discovery of a peculiar magnetar X-ray burst (MXB 221120) from SGR J1935+2154 associated with a fast radio burst
1
State Key Laboratory of Particle Astrophysics, Institute of High Energy Physics, Chinese Academy of Sciences, Beijing 100049, China
2
University of Chinese Academy of Sciences, Chinese Academy of Sciences, Beijing 100049, China
3
College of Physics and Hebei Key Laboratory of Photophysics Research and Application, Hebei Normal University, Shijiazhuang Hebei 050024, China
4
College of Electronic and Information Engineering, Tongji University, Shanghai 201804, China
5
Department of Nuclear Science and Technology, School of Energy and Power Engineering, Xi’an Jiaotong University, Xi’an 710049, China
6
Yunnan Observatories, Chinese Academy of Sciences, Kunming 650216, China
7
Key Laboratory for the Structure and Evolution of Celestial Objects, Chinese Academy of Sciences, Kunming 650216, China
8
Department of Astronomy, Peking University, Beijing 100871, China
9
National Astronomical Observatories, Chinese Academy of Sciences, Beijing 100101, China
10
Beijing Laser Acceleration Innovation Center, Huairou Beijing 101400, China
11
School of Physical Science and Technology, Southwest Jiaotong University, Chengdu 611756, China
12
Institute of High Energy Physics, Chinese Academy of Sciences, Beijing 100049, China
13
School of Physics and Electronic Science, Guizhou Normal University, Guiyang 550001, China
14
Guizhou Provincial Key Laboratory of Radio Astronomy and Data Processing, Guizhou Normal University, Guiyang 550001, China
15
Institute of Astrophysics, Central China Normal University, Wuhan 430079, China
16
Key Laboratory of Lithium Battery New Energy Materials and Devices of Jiangxi Education Department, College of Intelligent Manufacturing and Materials & Chemical Engineering, Yichun University, Yichun, Jiangxi Province 336000, China
17
School of Computer and Information, Dezhou University, Dezhou 253023, China
★ Corresponding author: This email address is being protected from spambots. You need JavaScript enabled to view it.
Received:
1
January
2026
Accepted:
8
February
2026
Abstract
Fast radio bursts (FRBs) are enigmatic cosmic transients of millisecond duration observed in the radio band. The identification of FRB-associated magnetar X-ray bursts (MXBs) from the galactic magnetar SGR J1935+2154 suggests that at least a fraction of FRBs can be produced from magnetar activity. However, the sample size of FRB-associated MXBs is still very small. Here we report a bright and peculiar FRB-associated MXB from SGR J1935+2154 detected by GECAM on November 20, 2022, dubbed MXB 221120. We find that the temporal and spectral properties of MXB 221120 exhibit distinctive features. Its light curve could generally be described by a single FRED function with the superposition of several narrow pulses. Interestingly, we identified a possible quasiperiodic oscillation feature with a center frequency of ∼18 Hz in this MXB. The time-integrated spectrum is best fit by a blackbody model with a temperature (kT) of 18.6 keV, rendering it the first thermal spectrum FRB-associated MXB from SGR J1935+2154. Compared to other MXBs with a single emission episode, MXB 221120 has a longer duration and a higher blackbody temperature, making it an outlier in the burst sample. These results indicate that MXB 221120 may have been produced by a special mechanism with extreme physical conditions.
Key words: X-rays: bursts
© The Authors 2026
 Open Access article, published by EDP Sciences, under the terms of the Creative Commons Attribution License (https://creativecommons.org/licenses/by/4.0), which permits unrestricted use, distribution, and reproduction in any medium, provided the original work is properly cited.
This article is published in open access under the Subscribe to Open model. This email address is being protected from spambots. You need JavaScript enabled to view it. to support open access publication.
1. Introduction
Magnetars are a unique type of neutron star (NS) that have typical spin periods of 2–12 s and spin-down rates of ∼10−13 − 10−10 s s−1. The energy emitted by magnetars is predominantly driven by magnetic fields (e.g., Ibrahim et al. 2004; Mereghetti et al. 2015) or magnetostatic energy (Katz 1982). The (dipole) magnetic fields of magnetars range from 1014 to 1015 Gauss, making them hundreds to thousands of times stronger than those of ordinary NSs (e.g., Katz 1982; Duncan & Thompson 1992; Thompson & Duncan 1995, 1996). Most magnetars are found in isolated systems but are sometimes found associated with a supernova remnant (Negro et al. 2024). The two most prominent manifestations of magnetars are soft gamma ray repeaters (SGRs) and anomalous X-ray pulsars (Mazets et al. 1979a,b; Mereghetti & Stella 1995; Mereghetti 2008). So far, about 30 magnetars have been discovered and confirmed in our Galaxy and in the Magellanic Clouds (Cline et al. 1982; Lamb et al. 2002). Although magnetars account for only a small fraction (less than 1%) of the observed NS population (Kaspi & Beloborodov 2017), they have played an important role in time-domain and multi-messenger astronomy.
The active galactic magnetar SGR J1935+2154 was first detected by Swift in 2014 (Stamatikos et al. 2014) and lies within the supernova remnant G57.2+0.8, with a distance in the range of 4–13 kpc (Mereghetti et al. 2020; Kothes et al. 2018; Zhong et al. 2020). SGR J1935+2154 has a spin period of P = 3.24 s and a period derivative of Ṗ = 1.43 × 10⁻¹¹ s s−1, implying a surface dipole magnetic field value of B ≈ 2.2 × 10¹⁴ Gauss (Israel et al. 2016).
SGR J1935+2154 usually produces short magnetar X-ray bursts (MXBs), and observational properties of these bursts have been studied. The light curve patterns of MXBs from SGR J1935+2154 were found to be complicated, with two fundamental patterns called fast rise exponential decay (FRED) and exponential rise and cutoff decay (ERCOD; Wang et al. 2025b). These bursts are likely generated by a kind of self-organizing critical process (Zhang et al. 2023b). The burst activity period was estimated to be ∼127 days (Xie et al. 2022). When using one or two blackbody (BB) spectra to represent the thermal emission and a high-energy cutoff power-law (CPL) spectra for the nonthermal emission, the mean peak energy Ep − CPL of these bursts is about 26 keV, the mean soft BB temperature kTBBs is about 5 keV, and the mean hard BB temperature kTBBh is about 9 keV (Rehan & Ibrahim 2023, 2024, 2025; Cai et al. 2022a,b; Lin et al. 2020; Xie et al. 2025).
Magnetars are not only important objects in the X-ray band but also a crucial bridge connecting the X-ray and radio bands. Fast radio bursts (FRBs) are transient cosmic sources observed in the radio band that last only a few milliseconds (e.g., Lorimer et al. 2007; Zhang 2020). Despite many studies, their origin remains a mystery. Proposed radiation mechanisms of FRBs can generally be classified into two categories: pulsar-like models (e.g., Zhang 2016; Lu et al. 2020; Yang & Zhang 2018; Katz 2014; Lu & Kumar 2018) and GRB-like models (e.g., Usov & Katz 2000; Lyubarsky 2014; Waxman 2017; Metzger et al. 2019; Beloborodov 2020). Both groups of models can be produced from magnetars (e.g., Popov & Postnov 2010; Katz 2016; Wadiasingh et al. 2020; Metzger et al. 2017; Beloborodov 2017).
On April 28, 2020, the Canadian Hydrogen Intensity Mapping Experiment (CHIME) and Survey for Transient Astronomical Radio Emission 2 radio telescope (STARE2) detected an FRB, dubbed FRB 200428, generally localized at SGR J1935+2154 (CHIME/FRB Collaboration 2020; Bochenek et al. 2020). Meanwhile, several high-energy telescopes, including the Hard X-ray Modulation Telescope (Insight-HXMT), detected an X-ray burst (dubbed MXB 200428 hereafter1) from SGR J1935+2154 that is temporally and positionally associated with FRB 200428 (Zhang et al. 2020; Li et al. 2021; Mereghetti et al. 2020; Tavani et al. 2021; Ridnaia et al. 2021). The details of the light curve and expected dispersion delay indicate that the radio burst and the X-ray burst are the same burst event. Significantly, Insight-HXMT first reported that the two narrow pulses in the X-ray burst are very likely an X-ray and a hard X-ray counterpart of FRB 200428 (Zhang et al. 2020). Therefore, FRB 200428 is the first galactic FRB and the first FRB with a high-energy electromagnetic counterpart. This discovery indicates that a fraction of the FRBs can be powered by magnetars. Remarkably, a 3.4σ quasiperiodic oscillation (QPO) feature at ∼40 Hz has been identified in the light curve of MXB 200428 (Li et al. 2022a), which is a rare phenomenon among other MXBs from this magnetar.
In October 2022, SGR J1935+2154 became active again and produced a series of bursts. On October 14, 2022, both GECAM-B and GECAM-C were triggered in-flight (Zhao et al. 2024; Huang et al. 2024) and from ground search (Cai et al. 2025a,b) by a bright MXB (designated MXB 221014) from SGR J1935+2154 that is associated with an FRB (Wang et al. 2022; Dong & Chime/FRB Collaboration 2022; Giri et al. 2023; Maan et al. 2022). MXB 221014 represents the first GECAM detection of an FRB-associated MXB and the second case of an MXB-FRB association following MXB/FRB 200428 (Wang et al. 2026).
After GECAM’s discovery of MXB 221014, more MXBs (candidates) from SGR J1935+2154 were reported to be associated with radio bursts. For instance, a weak X-ray burst (MXB 221021) detected by Insight-HXMT (Li et al. 2022b) was reported to be associated with a radio burst discovered by the Kunming 40-meter radio telescope at Yunnan Observatories (Huang et al. 2022).
In this paper, we report on a bright and peculiar MXB from SGR J1935+2154 detected by GECAM-B on November 20, 2022, termed MXB 221120, which is associated with an FRB also from SGR J1935+2154 detected by the Kunming 40-meter radio telescope at Yunnan Observatories (Li et al. 2025). This event is the second GECAM detection of an FRB-associated MXB. Here, we implemented detailed temporal and spectral analyses of this X-ray burst and made comparisons to other MXBs, especially those associated with FRB.
Throughout the paper, a standard cosmology with parameters H0 = 67.4 km s−1 Mpc−1, ΩM = 0.315, and ΩΛ = 0.685 is adopted (Planck Collaboration VI 2020). All parameter errors in this work are for the 68% confidence level if not otherwise stated.
This paper is organized as follows. The observation and data reduction are described in Sect. 2. Detailed temporal and spectral analyses are presented in Sect. 3. A brief discussion is given in Sect. 4, and a summary is given in Sect. 5.
2. Observation and data reduction
The Gravitational wave high-energy Electromagnetic Counterpart All-sky Monitor (GECAM) constellation is composed of four instruments, GECAM-A and -B (launched on December 10, 2020; Xiao et al. 2022a), GECAM-C (launched on July 27, 2022; Zhang et al. 2023a), and GECAM-D (also known as DRO/GTM, launched on March 14, 2024; Wang et al. 2024; Feng et al. 2024). The instruments are dedicated to monitoring all-sky gamma ray transients. GECAM-A and GECAM-B feature a dome-shaped array of 25 gamma ray detectors (GRDs) and 8 charged particle detectors (CPDs), while GECAM-C has 12 GRDs and 2 CPDs. All the GRDs of GECAM-B operate in two readout channels: high gain (HG, 15–350 keV) and low gain (LG, 350–6000 keV). The dedicated design of GECAM facilitates detection in both time-domain astronomy and space environment (Wang et al. 2025a).
At 2022-11-20T11:25:04.850 (denoted as T0, corresponding to MJD 59903.475751), GECAM-B was triggered in-flight (Zhao et al. 2024; Huang et al. 2024) and from ground search (Cai et al. 2025a,b) by a bright MXB (denoted as MXB 221120; Xie et al. 2025). Both in-flight and ground search localization (Zhao et al. 2023; Xie et al. 2025; Xiao et al. 2022b; Cai et al. 2025b) are consistent with SGR J1935+2154 within the error. At that time, GECAM-C, Insight-HXMT, and Fermi were in the South Atlantic Anomaly, which highlights the importance of the GECAM-B observation. Meanwhile, the Kunming 40-meter radio telescope (Hao et al. 2010) detected a radio burst from SGR J1935+2154, which was temporally associated with MXB 221120 (Li et al. 2025).
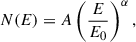
The light curve of MXB 221120 shows that this burst primarily consists of a single emission episode, i.e., a single FRED-shape pulse. The burst has a T90 (interval during which 90% of the X-ray burst fluence is detected) of 0.31 s (Fig. 1a).
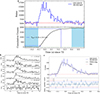 |
Fig. 1. The light curves and duration of MXB 221120. Panel a: Light curve in 10 ms resolution and duration (T90). The dashed red line in the top panel represents the background level. The blue shadow region in lower panel represents the background range. Panel b: Light curves in different energy bands observed by GECAM-B. Panel c: Light curve fitting with the FRED function. The light curve and FRED profile is plotted in the top panel, and the residuals are plotted in the lower panel. |
Since significant signals were observed exclusively in the HG channel of GECAM-B (Fig. 1b), only HG data were used for the data analysis. The temporal analysis was performed using detectors with an incident angle of less than 90° relative to the source (GRD 01, 02, 03, 04, 07, 08, 09, 10, 11, 17, 18, 19, 20, 25). For the spectral analysis, we utilized GECAMTools-v202405142 to extract the spectra of the GRDs with incident angles smaller than 60°, which are GRD 02, 03, 08, 09, 10, 18, 19 and 20. The energy range used for the spectral fit was 30–350 keV, considering the effective area and data quality.
3. Data analyses and results
3.1. Temporal analysis
3.1.1. Light curve fitting
Unlike MXB 200428, which consists of three broad bump-like components (Ge et al. 2023), the light curve of MXB 221120 shows a single emission episode with several peaks on it. Therefore, it can be characterized by an overall profile to capture the general behavior. We utilized a common FRED profile to fit the light curve (Norris et al. 1996):
 (1)
(1)
where A is the normalization parameter, tmax is the peak time, σ1 and σ2 are the rise and decay time, and ν is the sharpness of the pulse. The fitting result is shown in Fig. 1c.
By analyzing the light curves of a sample of MXBs (Xie et al. 2025) from SGR J1935+2154 detected by GECAM between 2021 and 2022, Wang et al. (2025b) found that the light curve patterns of MXBs can primarily be classified into three categories: FRED, ERCOD, and a combination of the two. The fundamental patterns FRED and ERCOD of MXBs exhibit distinct temporal and spectral characteristics (Wang et al. 2025b). Therefore, we also tried to fit the light curve with the ERCOD profile. The ERCOD function reads as
![Mathematical equation: $$ \begin{aligned} I(t) = {\left\{ \begin{array}{ll} A \cdot e^{\left(-\frac{|t - t_{\rm max}|}{\sigma _1}\right)^\nu },&t \le t_{\rm max}, \\ A \cdot B \cdot \left[1 - e^{\left(-\frac{|t - t_{\text{cut}}|}{\sigma _2}\right)}\right] ,&t_{\rm max} < t \le t_{\text{cut}}, \end{array}\right.} \end{aligned} $$](/articles/aa/full_html/2026/03/aa58841-26/aa58841-26-eq2.gif) (2)
(2)
where ![Mathematical equation: $ B = \left[1 - e^{\left(-\frac{|t_{\text{cut}} - t_{\mathrm{max}}|}{\sigma_2}\right)}\right]^{-1} $](/articles/aa/full_html/2026/03/aa58841-26/aa58841-26-eq3.gif) , and tcut is the cutoff time.
, and tcut is the cutoff time.
To test which profile is preferred, we used the Bayesian information criterion (BIC; Schwarz 1978) and reduced the chi-square to perform the model selection. As shown in Table 1, the fitting of the FRED profile to the light curve is significantly better than ERCOD.
Fitting results of the light curve.
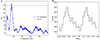 |
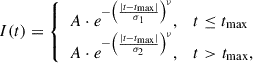
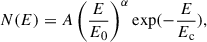
Fig. 2. Quasiperiodic oscillation search of MXB 221120. Panel a: |

3.1.2. QPO search
The significant QPO signal of ∼40 Hz found in MXB 200428 (Li et al. 2022a) motivated us to check whether there is a similar QPO signal in MXB 221120. We searched for a periodic signal through a  -test procedure in a frequency range (10–60 Hz) around the known 40 Hz with a step of 0.01 Hz and the number of harmonics (n) as one with the open-source Python software ‘stingray’ (Huppenkothen et al. 2019; Bachetti et al. 2024). During the time interval of T90, there is no significant signal in the
  periodogram. However, when the time interval is limited to –0.1 s to 0.1 s, during which the signal is relatively high in the light curve, a significant signal that exceeds the false alarm probability of 0.1% in the
  periodogram is located at F =
  Hz. The error was taken from the full width at half maximum of the peak of the
  curve. The
  periodogram and the false alarm probability level of 0.1% is shown in Fig. 2a. We further folded the burst photons in this time interval using the best-detected frequency (Fig. 2b). The phase light curve shows a sinusoidal structure with a significance of 4.2σ.
Interestingly, the QPO frequency of ∼18 Hz found in MXB 221120 is about half of the common QPO (candidates) frequency (i.e., ∼40 Hz) found in previous studies of MXBs (Li et al. 2022a; Xiao et al. 2024a). It is also worth noting that this frequency is somewhat close to the QPO frequency (∼22 Hz) found in the precursor of GRB 211211A, in which a magnetar is suggested to be involved in the compact binary merger (Xiao et al. 2024b).
Owing to the short duration and low frequency, the cycle number of the period is rather small (approximately four). Therefore, the significance of any potential low-frequency QPO would not be expected to be high, which is exactly the case that we find here. As the feature of millisecond peaks distinguishes FRB-associated MXBs from normal MXBs (Younes et al. 2020; Ge et al. 2023) and the peaks were also involved in the QPO of MXB 200428 (Li et al. 2022a), we consider that this possible QPO of MXB 221120 may also be contributed by the peaks superimposed on the broad component of the light curve (Fig. 1a).
The spectral results of MXB 221120.
3.2. Spectral analysis
We used Pyxspec software (Gordon & Arnaud 2021) to perform spectral analysis. Past studies have suggested that MXBs from SGR J1935+2154 can be described by phenomenological models such as a single BB or a double BB (BB plus BB) model for thermal emission or a CPL model for nonthermal emission (Lin et al. 2020; Rehan & Ibrahim 2023, 2024, 2025). For the time-integrated spectrum in the time interval of T90, we used five models: a BB model, a BB plus power law (PL) model, a CPL model, a CPL model with α fixed to -1 (corresponding to optically thin thermal bremsstrahlung, namely OTTB), and a double BB model. The PGSTAT3 (Jacoby & Barnes 1996) was taken into account to test the goodness-of-fit.
The BB (bbodyrad in Xspec4) model reads as
 (3)
(3)
Here, A = Rkm2/D102 is the normalization constant, where Rkm is the source radius in kilometers and D10 is the distance to the source in units of 10 kpc, and kT (keV) is the temperature.
The PL model reads as
 (4)
(4)
where A is the normalization constant (photons cm−2 s−1 keV−1), α is the power law photon index, and E0 is the pivot energy fixed at 1 keV.
The CPL model reads as
 (5)
(5)
where A is the normalization constant (photons cm−2 s−1 keV−1), α is the power law photon index, E0 is the pivot energy fixed at 1 keV, and Ec (keV) is the characteristic cutoff energy. The peak energy Ep (keV) is related to Ec through Ep = (2 + α)Ec.
We used the BIC (Schwarz 1978) to perform a model comparison. For each model, the BIC value was calculated, and a minimum BIC (BICmin) value was obtained. Models with ΔBIC = BIC–BICmin larger than four have considerably less support (Burnham & Anderson 2004). Since the parameters of the double BB model could not be constrained, the results of the first four spectral models are listed in Table 2. Among these four models, the BB model has the minimum BIC, while the ΔBIC of the BB plus PL model and the CPL model with α fixed to –1 are greater than four, indicating that these two models are not preferred. Furthermore, although the BIC of the CPL model is similar to that of the BB model, the α of the CPL model is violently deviated from the typical value (–1) and is consistent with the index of a BB spectrum with a Rayleigh-Jeans approximation in a low-energy band, further proving that the best model is the BB model (Fig. 3).
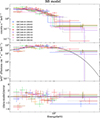 |
Fig. 3. Best spectrum fitting of MXB 221120. |
Under the BB model, the burst fluence (in 35–300 keV) is 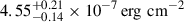 , with a total energy of ∼4.4 × 1039 erg when assuming a magnetar distance of 9 kpc (Zhong et al. 2020). Moreover, based on the normalization of the BB model, the emission region (radius) was calculated to be about 1.0 kilometer.
3.3. MXB sample comparison
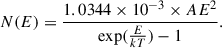
As presented above, MXB 221120 consists of a single emission episode that can be perfectly described by a FRED profile. The light curve patterns of MXBs from SGR J1935+2154 are mainly categorized into FRED, ERCOD, or a combination of these two fundamental patterns (Wang et al. 2025b). The MXBs with the ERCOD shape generally exhibit longer durations and are brighter and harder than those with a FRED shape (Wang et al. 2025b). We systematically compared the properties of MXB 221120 with those of samples displaying a FRED and ERCOD pattern. First, we respectively fit the burst duration and burst fluence of both FRED and ERCOD patterns with a power-law function. Although MXB 221120 is well described by a FRED profile, its burst duration is an outlier for the FRED-pattern bursts (Fig. 4a). In fact, its rise and decay times are closer to those of the ERCOD-pattern bursts (Fig. 4b).
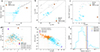 |
Fig. 4. Several properties of MXB 221120 in a sample distribution. Panel a: Position of duration (T90) and burst fluence in the sample of FRED MXBs and ERCOD MXBs. The solid lines represent the power-law fitting of the data, and the dashed lines represent the 1σ error region. Panel b: Position of rise time and decay time in the sample of FRED MXBs and ERCOD MXBs. The dotted gray lines indicate the ratio between rise time and decay time. Panel c: Position of kT and flux in the sample of FRED MXBs and ERCOD MXBs. Panel d: Position of α and Ep in the Fermi/GBM sample. Panel e: Position of kT and BB area in the Fermi/GBM sample. The solid lines represent the power-law fitting of the data, and the dashed lines represent the 1σ error region. Panel f: Position of fluence in the Fermi/GBM sample. In panels a–c, the sample is from Wang et al. (2025b). In panels d–f, the sample is from Rehan & Ibrahim (2023, 2024, 2025) |
In addition to its temporal properties, the spectral features of MXB 221120 also represent an outlier. The kTBB of MXB 221120 is higher than those of all FRED-pattern bursts and ERCOD-pattern bursts (Fig. 4c), indicating a significantly harder fireball emission from MXB 221120. Furthermore, as the CPL model can also describe the burst, we compared the parameters of the CPL model of MXB 221120 to other MXBs from SGR J1935+2154 detected by Fermi/GBM from 2021 to 2022 (Rehan & Ibrahim 2023, 2024, 2025). We note that for the Ep of MXB 200428, we used the value of 65 keV from INTEGRAL/IBIS (Mereghetti et al. 2020) rather than 37 keV from Insight-HXMT (Li et al. 2021). The reason is that the result of Insight-HXMT/HE is for a longer time period for the burst. If the time period around the peaks had been considered, a similar Ep to that of INTEGRAL/IBIS would have been obtained (Ge et al. 2023; Zheng et al. 2025). It can be seen that the Ep of MXB 221120 is higher than all GBM samples, including that of MXB 200428 (Fig. 4d).
The fitting of the double BB model for MXBs from SGR J1935+2154 facilitates the evaluation of the correlation between the BB emission areas (represented by the square of the source radius) and the kTBB (Lin et al. 2020; Rehan & Ibrahim 2023, 2024, 2025). We fit the BB model parameters (kT and emission area) of soft and hard components of all MXB samples detected by Fermi/GBM during 2021 to 2022 using a PL function, yielding slopes of –2.09 for the soft components and –3.97 for the hard components, respectively (Fig. 4e). Interestingly, the kTBB of MXB 221120 is consistent with the hard BB component region. This may indicate that MXB 221120 may still be in accordance with the double BB scenario. Due to the limitation of observation data or the much lower energy of the soft BB component, the soft BB component cannot be significantly detected. Notably, compared to all the samples from Fermi/GBM, both the kTBB and the fluence of MXB 221120 are relatively large, but not outliers (see Figs. 4e and 4f). Indeed, it is worth noting that the fluences of all three FRB-associated MXBs (i.e., MXB 200428, MXB 221014, MXB 221120) are located in a rather narrow range (Fig. 4f). Whether this is intrinsic behavior or just a coincidence is yet to be studied with more samples.
With these comparison studies, we find that while some properties of MXB 221120 fall within normal ranges among the burst sample (Figs. 4e and 4f), both the duration and kTBB of MXB 221120 are significant outliers among bursts characterized by a single process (either FRED pattern or ERCOD pattern; Figs. 4a, 4b, and 4c). These results make the MXB 221120 a very peculiar burst and provide important implications on the physical processes.
4. Discussion
The MXB 221120 was discovered at the tail end of the third active period of SGR J1935+2154 after MXB 200428. In contrast to the first two active periods (September 2021 and January 2022), during which no FRB-associated MXB was reported, in the third active period (October 2022) several FRB-associated MXBs were reported, including those produced after the end of this active period (Wang et al. 2022; Dong & Chime/FRB Collaboration 2022; Giri et al. 2023; Maan et al. 2022; Li et al. 2022b; Huang et al. 2022; Rehan & Ibrahim 2025).
Compared to the bursts observed in October 2022, MXB 221120 exceeds the mean burst duration by a factor of about three, while the fluence is comparable to the mean value (Rehan & Ibrahim 2025). The Ep of MXB 221120 is about three times higher than the mean Ep of these bursts, while the kTBB is also higher than the mean value (Rehan & Ibrahim 2025). The longer duration and harder spectrum of MXB 221120 are consistent with that of MXB 200428, compared to other bursts in their respective active period (Rehan & Ibrahim 2025; Younes et al. 2021). These characteristics may represent the common properties that distinguish FRB-associated MXBs from ordinary MXBs, with previous studies also noting that waiting times during the FRB episode are significantly shorter compared to other active periods (Xie et al. 2024).
From 2020 to 2022, the Ep and hard kTBB of bursts from SGR J1935+2154 both exhibited a slight softening trend (Rehan & Ibrahim 2025). However, the Ep of MXB 221120 is considerably higher, even higher than that of MXB 200428 (Fig. 4d). Rather than attributing this discrepancy to physical origins, we propose that it is more likely due to data limitations. The deficiency of lower energy band data of GECAM-B may lead to an overestimation of Ep in MXB 221120. This conclusion is supported by the fact that the maximum effective plasma temperature (kTe, max) of about 24 keV, derived from Ep ∼ 3 kTe, max (Thompson & Duncan 1995; Lin et al. 2020), is significantly higher than kTBB.
A possible QPO signal is observed in MXB 221120, with a center frequency of 17.97 Hz, about half of the 40 Hz QPO in MXB 200428 (Li et al. 2022a). The most common explanation for the occurrence of a QPO signal is the torsional oscillations of the magnetar crust (Negro et al. 2024). The possible QPO signal of ∼ 18 Hz in MXB 221120 is consistent with a low-order crustal torsional eigenmode of a magnetar (Duncan 1998; Wadiasingh & Chirenti 2020). On the other hand, in the case of MXB 200428, millisecond peaks aligning with the FRB pulses are involved in the oscillation. Therefore, this possible QPO signal in MXB 221120 may also be related to narrow peaks. Wu et al. (2025) proposed that these narrow X-ray peaks can be attributed to the inverse Compton scattering (ICS) of FRB photons by an extreme pair flow around the light cylinder, in which the pair flow possibly originates from the compression and acceleration due to rapid rearrangement of the magnetic field and magnetic reconnection in the current sheet. In this scenario, the QPO in X-ray peaks may be caused by either the FRB photons or by extreme pair flow, and the essence of the oscillation is attributed to the regular evolution of the magnetosphere.
We note that MXB 221120 is the first thermal spectrum MXB associated with an FRB from SGR J1935+2154. MXB 221120 is best fit by a BB model with a temperature of 18.6 keV, exhibiting a significant proportion of thermal radiation. Notably, the thermalization is universal for normal MXBs, and the temperature of about 20 keV is consistent with the theoretical prediction (Katz 1996). However, for FRB-associated MXBs, MXB 221120 is the first case that is dominated by thermal emission. We stress that this thermal spectrum contradicts previous observations (Li et al. 2021; Mereghetti et al. 2020) and challenges current theoretical models (Younes et al. 2021; Yang & Zhang 2021; Lin et al. 2011), which suggest that the FRB-associated MXBs are dominated by nonthermal components. To check whether there is purely thermal emission in this burst, we estimated the photon number density of this burst by  , where ℱ is the burst flux per kT, d is the source distance of 9 kpc, and R is the emission region size (Lin et al. 2020). The nγ of MXB 221120 is ∼1.1 × 1026 cm−3, and this value is comparable to the photon density of a purely Planckian distribution, 0.24 (kT/[λc mec2])3 ∼ 2 × 1026 cm−3, for a reduced electron Compton wavelength, λc = ℏ/mec (Lin et al. 2020). This result indicates a perfect thermalization of this burst emission.
Normal MXBs are usually suggested to be produced from the rapid release of magnetic energy when the sudden cracking of the magnetar crust is induced by the twisted magnetic field. The released energy excites plasma, generating a photon pair plasma bubble confined by closed magnetic field lines, referred to as a “trapped fireball”. This trapped fireball cools and shrinks through X-ray emissions observed as MXB bursts. Due to the high opacity of plasma and local thermodynamic equilibrium, the emissions are thermalized, as reflected in the burst spectra (e.g., Thompson & Duncan 1995; Cheng et al. 1996; Younes et al. 2014; Katz 1996).
For FRB-associated MXBs, it is believed that after the FRB is emitted, the electron plasma in the magnetar magnetosphere would be accelerated or decelerated by the radiation force to reach an equilibrium state. The X-ray spectrum is then altered by resonant Compton scattering of these balanced relativistic electrons, resulting in a high-energy cutoff, as in the case of MXB 200428 (Yang & Zhang 2021; Yamasaki et al. 2020).
In MXB 221120, the dominant BB spectrum suggests that thermal photons escape from the trapped fireball with a size of about 1 km without undergoing resonant Compton scattering. Two possible scenarios could explain why scattering may not occur. One scenario is that the electron density in the magnetosphere is relatively low, resulting in insufficient scattering. The other scenario is that the radiation emitted by the fireball is not spatially co-located with the high-density electrons in the magnetosphere.
As an event characterized by a single process (namely a single FRED shape), MXB 221120 exhibits an unusually long duration and high kT compared to other MXBs characterized by the same single process. From the perspective of its association with FRB, this is a natural result of a burst occurring near the polar cap region. Since FRBs are more likely to be triggered near polar caps (Beloborodov 2009; Yang & Zhang 2021; Rehan & Ibrahim 2025), a dichotomy arises between FRB-associated MXBs and “orphan” MXBs, with the former occurring in quasipolar regions and the latter occurring far from the polar caps (Younes et al. 2021). The strong local magnetic fields near the polar cap lead to tighter confinement of the fireball, resulting in a higher temperature and smaller emission area, consistent with observations (Fig. 4e). Thus, as an FRB-associated MXB, MXB 221120 is distinctive in that its emission exhibits a single emission process lasting for an extended duration. Given that the trigger mechanism for MXBs is analogous to earthquakes (Thompson & Duncan 1995; Cheng et al. 1996), we suggest that this burst is likely caused by a single crust crack.
5. Summary
The MXB 221120 is a bright and peculiar FRB-associated MXB detected by GECAM-B from SGR J1935+2154. In this study, we comprehensively analyzed this burst, found interesting temporal and spectral properties, and discussed physical implications and interpretations.
In this burst, we find a possible QPO signal with a center frequency of about 18 Hz, which is about half of the 40 Hz QPO found in MXB 200428 (Li et al. 2022a). We suggest that this possible QPO can be attributed to a low-order crustal torsional eigenmode of a magnetar (Duncan 1998; Wadiasingh & Chirenti 2020), similar to that in MXB 200428 (Li et al. 2022a). Additionally, this QPO may be phenomenologically related to narrow pulses, suggesting that it may reflect the regular evolution of the magnetosphere (Wu et al. 2025).
We also find that this burst is best fit by a BB model with a temperature of 18.6 keV, rendering it the first thermal spectrum FRB-associated MXB from SGR J1935+2154. This finding contradicts previous observations (Li et al. 2021; Mereghetti et al. 2020) and challenges current theoretical models (Younes et al. 2021; Yang & Zhang 2021), which propose that the FRB-associated MXBs are dominated by nonthermal components resulting from resonant Compton scattering. However, the thermal spectrum indicates that photons escape from the trapped fireball without undergoing scattering either due to the relatively low electron density in the magnetosphere, resulting in insufficient scattering, or because the radiation from the fireball is not spatially co-located with the high-density electrons in the magnetosphere. Regardless of the scenario, the spectral features of MXB 221120 necessitate specific geometric or physical conditions.
Moreover, we note that the whole burst can generally be described by a single FRED function, and it exhibits an unusually long duration and high kT compared to other MXBs characterized by the same single process, making it an outlier in the burst sample. Given that the FRB-associated MXB is likely triggered in the polar cap region, where strong local magnetic fields lead to tighter confinement of the fireball and consequently result in a higher temperature, MXB 221120 is notable for its emission exhibiting a single process that lasts for an extended duration. This observation suggests that the burst is likely related to a single fracture in the crust from a singular dissipation of internal magnetic energy rather than multiple fragmented cracks arising from multiple separated triggers.
To summarize, we find that the temporal and spectral properties of MXB 221120 observed by GECAM-B indicate that this FRB-associated MXB is a very peculiar burst. It may have been produced by a special mechanism with extreme physical conditions, which if identified would shed light on the origin of the MXB as well as the FRB.
Acknowledgments
We acknowledge the support by the National Key R&D Program of China (2021YFA0718500), HXMT+GECAM the National Natural Science Foundation of China (Grant Nos. 12273042, 12494572, 12373047, 12333007 ), China’s Space Origins Exploration Program, the Strategic Priority Research Program of the Chinese Academy of Sciences (Grant Nos. XDA30050000, and XDB0550300 ) and the Science Research Project of Hebei Education Department (BJ2026091). The GECAM (Huairou-1) mission is supported by the Strategic Priority Research Program on Space Science (Grant No. XDA15360000) of Chinese Academy of Sciences. We would like to acknowledge helpful discussions with Wen-Long Zhang.
References
- Bachetti, M., Huppenkothen, D., Stevens, A., et al. 2024, J. Open Source Software, 9, 7389 [Google Scholar]
- Beloborodov, A. M. 2009, ApJ, 703, 1044 [NASA ADS] [CrossRef] [Google Scholar]
- Beloborodov, A. M. 2017, ApJ, 843, L26 [NASA ADS] [CrossRef] [Google Scholar]
- Beloborodov, A. M. 2020, ApJ, 896, 142 [NASA ADS] [CrossRef] [Google Scholar]
- Bochenek, C. D., Ravi, V., Belov, K. V., et al. 2020, Nature, 587, 59 [NASA ADS] [CrossRef] [Google Scholar]
- Burnham, K. P., & Anderson, D. R. 2004, Soc. Method Res., 33, 261 [Google Scholar]
- Cai, C., Xue, W.-C., Li, C.-K., et al. 2022a, ApJS, 260, 24 [NASA ADS] [CrossRef] [Google Scholar]
- Cai, C., Xiong, S.-L., Lin, L., et al. 2022b, ApJS, 260, 25 [NASA ADS] [CrossRef] [Google Scholar]
- Cai, C., Zhang, Y.-Q., Xiong, S.-L., et al. 2025a, Sci. China Phys. Mech., 68, 239511 [Google Scholar]
- Cai, C., Zhang, Y.-Q., Xiong, S.-L., et al. 2025b, ApJS, 277, 9 [Google Scholar]
- Cheng, B., Epstein, R. I., Guyer, R. A., & Young, A. C. 1996, Nature, 382, 518 [NASA ADS] [CrossRef] [Google Scholar]
- CHIME/FRB Collaboration (Andersen, B. C., et al.) 2020, Nature, 587, 54 [Google Scholar]
- Dong, F. A., & Chime/FRB Collaboration 2022, ATel., 15681, 1 [NASA ADS] [Google Scholar]
- Cline, T. L., Desai, U. D., Teegarden, B. J., et al. 1982, ApJ, 255, L45 [NASA ADS] [CrossRef] [Google Scholar]
- Duncan, R. C. 1998, ApJ, 498, L45 [NASA ADS] [CrossRef] [Google Scholar]
- Duncan, R. C., & Thompson, C. 1992, ApJ, 392, L9 [Google Scholar]
- Feng, P.-Y., An, Z.-H., Zhang, D.-L., et al. 2024, Sci. China Phys. Mech., 67, 111013 [Google Scholar]
- Ge, M. Y., Liu, C. Z., Zhang, S. N., et al. 2023, ApJ, 953, 67 [Google Scholar]
- Giri, U., Andersen, B. C., Chawla, P., et al. 2023, ArXiv e-prints [arXiv:2310.16932] [Google Scholar]
- Gordon, C., & Arnaud, K. 2021, Astrophysics Source Code Library [record ascl:2101.014] [Google Scholar]
- Hao, L.-F., Wang, M., & Yang, J. 2010, RAA, 10, 805 [Google Scholar]
- Huang, Y. X., Xu, H., Xu, Y. H., et al. 2022, ATel., 15707, 1 [Google Scholar]
- Huang, Y., Shi, D., Zhang, X., et al. 2024, RAA, 24, 104004 [Google Scholar]
- Huppenkothen, D., Bachetti, M., Stevens, A. L., et al. 2019, ApJ, 881, 39 [Google Scholar]
- Ibrahim, A. I., Markwardt, C. B., Swank, J. H., et al. 2004, ApJ, 609, L21 [CrossRef] [Google Scholar]
- Israel, G. L., Esposito, P., Rea, N., et al. 2016, MNRAS, 457, 3448 [NASA ADS] [CrossRef] [Google Scholar]
- Jacoby, G. H., & Barnes, J. 1996, ASP Conf. Ser., 101, 1996 [Google Scholar]
- Kaspi, V. M., & Beloborodov, A. M. 2017, ARA&A, 55, 261 [Google Scholar]
- Katz, J. I. 1982, ApJ, 260, 371 [Google Scholar]
- Katz, J. I. 1996, ApJ, 463, 305 [NASA ADS] [CrossRef] [Google Scholar]
- Katz, J. I. 2014, Phys. Rev. D, 89, 103009 [NASA ADS] [CrossRef] [Google Scholar]
- Katz, J. I. 2016, ApJ, 826, 226 [CrossRef] [Google Scholar]
- Kothes, R., Sun, X., Gaensler, B., & Reich, W. 2018, ApJ, 852, 54 [NASA ADS] [CrossRef] [Google Scholar]
- Lamb, R. C., Fox, D. W., Macomb, D. J., & Prince, T. A. 2002, ApJ, 574, L29 [Google Scholar]
- Li, C. K., Lin, L., Xiong, S. L., et al. 2021, Nat. Astron., 5, 378 [NASA ADS] [CrossRef] [Google Scholar]
- Li, X., Ge, M., Lin, L., et al. 2022a, ApJ, 931, 56 [NASA ADS] [CrossRef] [Google Scholar]
- Li, X. B., Zhang, S. N., Xiong, S. L., et al. 2022b, ATel., 15708, 1 [Google Scholar]
- Li, X.-B., Huang, Y.-X., & Xu, H. 2025, Sci. Adv., submitted [Google Scholar]
- Lin, L., Kouveliotou, C., Göǧüş, E., et al. 2011, ApJ, 740, L16 [Google Scholar]
- Lin, L., Göğüş, E., Roberts, O. J., et al. 2020, ApJ, 902, L43 [NASA ADS] [CrossRef] [Google Scholar]
- Lorimer, D. R., Bailes, M., McLaughlin, M. A., Narkevic, D. J., & Crawford, F. 2007, Science, 318, 777 [Google Scholar]
- Lu, W., & Kumar, P. 2018, MNRAS, 477, 2470 [Google Scholar]
- Lu, W., Kumar, P., & Zhang, B. 2020, MNRAS, 498, 1397 [NASA ADS] [CrossRef] [Google Scholar]
- Lyubarsky, Y. 2014, MNRAS, 442, L9 [Google Scholar]
- Maan, Y., Leeuwen, J. V., Straal, S., & Pastor-Marazuela, I. 2022, ATel., 15697, 1 [Google Scholar]
- Mazets, E. P., Golenetskij, S. V., & Guryan, Y. A. 1979a, Sov. Astron. Lett., 5, 343 [NASA ADS] [Google Scholar]
- Mazets, E. P., Golentskii, S. V., Ilinskii, V. N., Aptekar, R. L., & Guryan, I. A. 1979b, Nature, 282, 587 [NASA ADS] [CrossRef] [Google Scholar]
- Mereghetti, S. 2008, A&ARv, 15, 225 [NASA ADS] [CrossRef] [Google Scholar]
- Mereghetti, S., & Stella, L. 1995, ApJ, 442, L17 [Google Scholar]
- Mereghetti, S., Pons, J. A., & Melatos, A. 2015, Space Sci. Rev., 191, 315 [NASA ADS] [CrossRef] [Google Scholar]
- Mereghetti, S., Savchenko, V., Ferrigno, C., et al. 2020, ApJ, 898, L29 [Google Scholar]
- Metzger, B. D., Berger, E., & Margalit, B. 2017, ApJ, 841, 14 [NASA ADS] [CrossRef] [Google Scholar]
- Metzger, B. D., Margalit, B., & Sironi, L. 2019, MNRAS, 485, 4091 [NASA ADS] [CrossRef] [Google Scholar]
- Negro, M., Younes, G., Wadiasingh, Z., et al. 2024, Front. Astron, 11, 1388953 [Google Scholar]
- Norris, J. P., Nemiroff, R. J., Bonnell, J. T., et al. 1996, ApJ, 459, 393 [NASA ADS] [CrossRef] [Google Scholar]
- Planck Collaboration VI. 2020, A&A, 641, A6 [NASA ADS] [CrossRef] [EDP Sciences] [Google Scholar]
- Popov, S. B., & Postnov, K. A. 2010, in Evolution of Cosmic Objects through their Physical Activity, eds. H. A. Harutyunian, A. M. Mickaelian, & Y. Terzian, 129 [Google Scholar]
- Rehan, N. S., & Ibrahim, A. I. 2023, ApJ, 950, 121 [Google Scholar]
- Rehan, N. S., & Ibrahim, A. I. 2024, ApJ, 969, 38 [Google Scholar]
- Rehan, N. S., & Ibrahim, A. I. 2025, ApJS, 276, 60 [Google Scholar]
- Ridnaia, A., Svinkin, D., Frederiks, D., et al. 2021, Nat. Astron., 5, 372 [NASA ADS] [CrossRef] [Google Scholar]
- Schwarz, G. 1978, Ann. Stat., 6, 461 [Google Scholar]
- Stamatikos, M., Malesani, D., Page, K. L., & Sakamoto, T. 2014, GCN, 16520, 1 [Google Scholar]
- Tavani, M., Casentini, C., Ursi, A., et al. 2021, Nat. Astron., 5, 401 [NASA ADS] [CrossRef] [Google Scholar]
- Thompson, C., & Duncan, R. C. 1995, MNRAS, 275, 255 [Google Scholar]
- Thompson, C., & Duncan, R. C. 1996, AJ, 473, 322 [Google Scholar]
- Usov, V. V., & Katz, J. I. 2000, A&A, 364, 655 [Google Scholar]
- Wadiasingh, Z., & Chirenti, C. 2020, ApJ, 903, L38 [NASA ADS] [CrossRef] [Google Scholar]
- Wadiasingh, Z., Beniamini, P., Timokhin, A., et al. 2020, ApJ, 891, 82 [Google Scholar]
- Wang, C. W., Xiong, S. L., Zhang, Y. Q., et al. 2022, ATel., 15682, 1 [NASA ADS] [Google Scholar]
- Wang, C., Zhang, J., Zheng, S., et al. 2024, Exp. Astron., 57, 26 [Google Scholar]
- Wang, C. W., Xiong, S. L., Wang, Y., et al. 2026, MNRAS, 546, stag312 [Google Scholar]
- Wang, C., Xiong, S., Zhao, Y., et al. 2025a, Sci. China Phys. Mech., 69, 229513 [Google Scholar]
- Wang, Y., Wang, C.-W., Xiong, S.-L., et al. 2025b, ApJ, 993, 24 [Google Scholar]
- Waxman, E. 2017, ApJ, 842, 34 [NASA ADS] [CrossRef] [Google Scholar]
- Wu, Y., Yang, Y.-P., Wang, F.-Y., & Dai, Z.-G. 2025, ApJ, 988, 274 [Google Scholar]
- Xiao, S., Liu, Y. Q., Peng, W. X., et al. 2022a, MNRAS, 511, 964 [NASA ADS] [CrossRef] [Google Scholar]
- Xiao, S., Xiong, S.-L., Cai, C., et al. 2022b, MNRAS, 514, 2397 [Google Scholar]
- Xiao, S., Li, X.-B., Xue, W.-C., et al. 2024a, MNRAS, 527, 11915 [Google Scholar]
- Xiao, S., Zhang, Y.-Q., Zhu, Z.-P., et al. 2024b, ApJ, 970, 6 [Google Scholar]
- Xie, S.-L., Cai, C., Xiong, S.-L., et al. 2022, MNRAS, 517, 3854 [NASA ADS] [CrossRef] [Google Scholar]
- Xie, S.-L., Yu, Y.-W., Xiong, S.-L., et al. 2024, ApJ, 967, 108 [Google Scholar]
- Xie, S.-L., Cai, C., Yu, Y.-W., et al. 2025, ApJS, 277, 5 [Google Scholar]
- Yamasaki, S., Lyubarsky, Y., Granot, J., & Göǧüş, E. 2020, MNRAS, 498, 484 [Google Scholar]
- Yang, Y.-P., & Zhang, B. 2018, ApJ, 868, 31 [NASA ADS] [CrossRef] [Google Scholar]
- Yang, Y.-P., & Zhang, B. 2021, ApJ, 919, 89 [NASA ADS] [CrossRef] [Google Scholar]
- Younes, G., Kouveliotou, C., van der Horst, A. J., et al. 2014, ApJ, 785, 52 [Google Scholar]
- Younes, G., Güver, T., Kouveliotou, C., et al. 2020, ApJ, 904, L21 [CrossRef] [Google Scholar]
- Younes, G., Baring, M. G., Kouveliotou, C., et al. 2021, Nat. Astron., 5, 408 [Google Scholar]
- Zhang, B. 2016, ApJ, 827, L31 [Google Scholar]
- Zhang, B. 2020, Nature, 587, 45 [CrossRef] [Google Scholar]
- Zhang, S.-N., Xiong, S. L., Li, K. C., et al. 2020, GCN, 27675, 1 [Google Scholar]
- Zhang, D., Zheng, C., Liu, J., et al. 2023a, Nucl. Instrum. Methods Phys. Res. Sect. A, 1056, 168586 [Google Scholar]
- Zhang, W.-L., Li, X.-J., Yang, Y.-P., et al. 2023b, RAA, 23, 115013 [Google Scholar]
- Zhao, Y., Xue, W.-C., Xiong, S.-L., et al. 2023, ApJS, 265, 17 [Google Scholar]
- Zhao, X.-Y., Xiong, S.-L., Wen, X.-Y., et al. 2024, RAA, 24, 104002 [Google Scholar]
- Zheng, C., Xiong, S.-L., Li, C.-K., et al. 2025, Sci. China Phys. Mech., 68, 271011 [Google Scholar]
- Zhong, S.-Q., Dai, Z.-G., Zhang, H.-M., & Deng, C.-M. 2020, ApJ, 898, L5 [NASA ADS] [CrossRef] [Google Scholar]
It was tentatively called an XRB (acronym of X-ray burst) in the literature, but XRB was already in use to refer to X-ray binaries. Therefore, we suggest referring to it as a magnetar X-ray burst (MXB) in accordance with the magnetar giant flare (MGF).
All Tables
All Figures
|
Fig. 1. The light curves and duration of MXB 221120. Panel a: Light curve in 10 ms resolution and duration (T90). The dashed red line in the top panel represents the background level. The blue shadow region in lower panel represents the background range. Panel b: Light curves in different energy bands observed by GECAM-B. Panel c: Light curve fitting with the FRED function. The light curve and FRED profile is plotted in the top panel, and the residuals are plotted in the lower panel. |
| In the text | |
|
Fig. 2. Quasiperiodic oscillation search of MXB 221120. Panel a: |
| In the text | |
|
Fig. 3. Best spectrum fitting of MXB 221120. |
| In the text | |
|
Fig. 4. Several properties of MXB 221120 in a sample distribution. Panel a: Position of duration (T90) and burst fluence in the sample of FRED MXBs and ERCOD MXBs. The solid lines represent the power-law fitting of the data, and the dashed lines represent the 1σ error region. Panel b: Position of rise time and decay time in the sample of FRED MXBs and ERCOD MXBs. The dotted gray lines indicate the ratio between rise time and decay time. Panel c: Position of kT and flux in the sample of FRED MXBs and ERCOD MXBs. Panel d: Position of α and Ep in the Fermi/GBM sample. Panel e: Position of kT and BB area in the Fermi/GBM sample. The solid lines represent the power-law fitting of the data, and the dashed lines represent the 1σ error region. Panel f: Position of fluence in the Fermi/GBM sample. In panels a–c, the sample is from Wang et al. (2025b). In panels d–f, the sample is from Rehan & Ibrahim (2023, 2024, 2025) |
| In the text | |
Current usage metrics show cumulative count of Article Views (full-text article views including HTML views, PDF and ePub downloads, according to the available data) and Abstracts Views on Vision4Press platform.
Data correspond to usage on the plateform after 2015. The current usage metrics is available 48-96 hours after online publication and is updated daily on week days.
Initial download of the metrics may take a while.