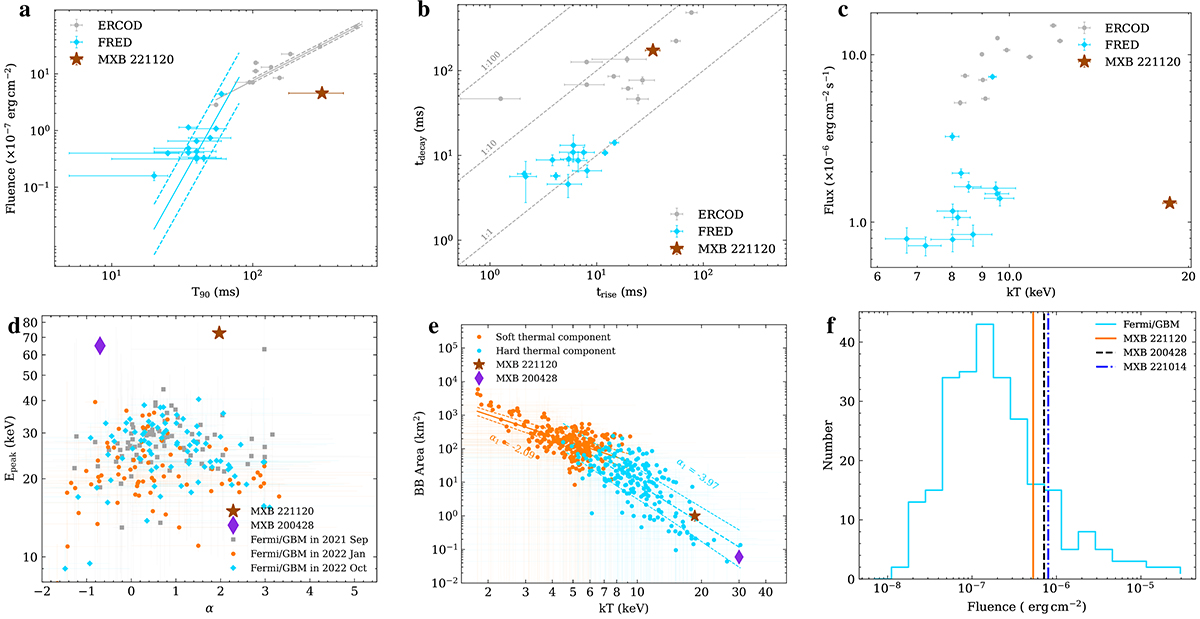
Fig. 4.
Download original image
Several properties of MXB 221120 in a sample distribution. Panel a: Position of duration (T90) and burst fluence in the sample of FRED MXBs and ERCOD MXBs. The solid lines represent the power-law fitting of the data, and the dashed lines represent the 1σ error region. Panel b: Position of rise time and decay time in the sample of FRED MXBs and ERCOD MXBs. The dotted gray lines indicate the ratio between rise time and decay time. Panel c: Position of kT and flux in the sample of FRED MXBs and ERCOD MXBs. Panel d: Position of α and Ep in the Fermi/GBM sample. Panel e: Position of kT and BB area in the Fermi/GBM sample. The solid lines represent the power-law fitting of the data, and the dashed lines represent the 1σ error region. Panel f: Position of fluence in the Fermi/GBM sample. In panels a–c, the sample is from Wang et al. (2025b). In panels d–f, the sample is from Rehan & Ibrahim (2023, 2024, 2025)
Current usage metrics show cumulative count of Article Views (full-text article views including HTML views, PDF and ePub downloads, according to the available data) and Abstracts Views on Vision4Press platform.
Data correspond to usage on the plateform after 2015. The current usage metrics is available 48-96 hours after online publication and is updated daily on week days.
Initial download of the metrics may take a while.