Fig. 1
Download original image
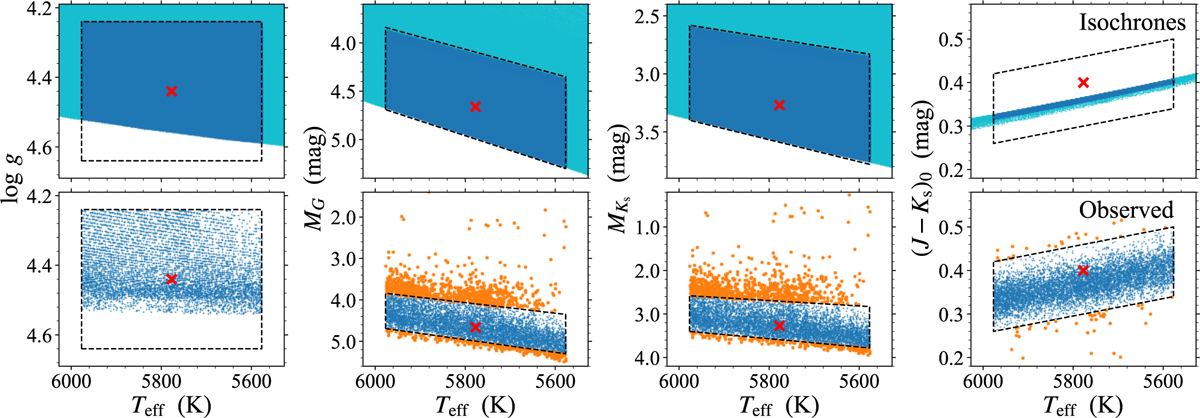
Some parameters of theoretical isochrones (top) and observed solar twin candidates (bottom). The horizontal axes in all the panels represent Teff, while the vertical axes represent some other parameters (log g, MG, MKs, and (J - Ks)⊙). Cyan dots in the upper panels show the isochrone grid points satisfying −0.1 < [M/H]curr < +0.1 dex. Blue dots in the upper panels show a subset of them having Teff and log g between ±200 K and ±0.2 around the solar values, which is the selection criterion of our solar twin candidates in Sect. 2.1 and is represented as a rectangle outlined with black dashes in the left panels. The trapezoids outlined in black dashes in the rest of the panels show the selection criteria for good solar twins in Sect. 2.4. Dots in the lower panels show the parameters of the 7775 observed solar twin candidates with good distances and 2MASS data. Orange dots in the lower panels show a subset of solar twins that do not satisfy the selection criteria (i.e., outside of the trapezoids). Red crosses show the reference solar values provided in Sect. 4.1 and (J - Ks)⊙ = 0.40 (Willmer 2018). We note that several outliers of observed solar twin candidates fall outside the plotted range and are not shown in the figures.
Current usage metrics show cumulative count of Article Views (full-text article views including HTML views, PDF and ePub downloads, according to the available data) and Abstracts Views on Vision4Press platform.
Data correspond to usage on the plateform after 2015. The current usage metrics is available 48-96 hours after online publication and is updated daily on week days.
Initial download of the metrics may take a while.