| Issue |
A&A
Volume 707, March 2026
|
|
|---|---|---|
| Article Number | A260 | |
| Number of page(s) | 25 | |
| Section | Catalogs and data | |
| DOI | https://doi.org/10.1051/0004-6361/202658913 | |
| Published online | 12 March 2026 | |
Solar twins in Gaia DR3 GSP-Spec
I. Building a large catalog of solar twins with ages
1
Department of Physics, Tokyo Metropolitan University,
1-1 Minami-Osawa,
Hachioji,
Tokyo
192-0397,
Japan
2
National Astronomical Observatory of Japan,
2-21-1 Osawa,
Mitaka,
Tokyo
181-8588,
Japan
3
Université Côte d’Azur, Observatoire de la Côte d’Azur, CNRS, Laboratoire Lagrange,
Bd de l’Observatoire, CS 34229,
06304
Nice cedex 4,
France
★★ Corresponding author: This email address is being protected from spambots. You need JavaScript enabled to view it.
Received:
10
January
2026
Accepted:
28
January
2026
Abstract
Context. Solar twins, stars whose stellar parameters (effective temperature, Teff; surface gravity, log g; and metallicity, [M/H]) are very close to those of the Sun, offer a unique opportunity to investigate Galactic archaeology with very high accuracy and precision. However, most previous catalogs of solar twins contain only a small number of objects (typically a few dozen), and their selection functions are poorly characterized.
Aims. Our aim is to build a large catalog of solar twins from Gaia DR3 GSP-Spec data, providing stellar parameters and ages determined using a model-driven (rather than a data-driven) method, together with a well-characterized selection function.
Methods. Using stellar parameters from the Gaia DR3 GSP-Spec catalog, we selected solar twin candidates whose parameters lie within ±200 K in Teff, ±0.2 in log g, and ±0.1 dex in [M/H] of the solar values. Candidates unlikely to be genuine solar twins were removed using Gaia flags and photometric constraints. We determined accurate ages for individual twins with a Bayesian isochroneprojection method by considering three combinations of parameters: Teff and [M/H] combined with either log g, MG, or MKs. We also constructed a mock catalog to characterize the properties and selection function of our observed sample.
Results. Our final GSP-Spec solar twin catalog contains 6594 stars. The mock catalog consisting of 75 588 artificial twins reproduces the main characteristics of the observed catalog well, especially for ages determined with MG or MKs. To demonstrate the usefulness of our catalog, we compared chemical abundances [X/Fe] with age. We statistically confirmed the age-[X/Fe] relations for several species (e.g., Al, Si, Ca, and Y), demonstrating that trends previously identified in small but very high precision samples persist in a much larger, independent sample.
Conclusions. Our study bridges small high-precision solar twin samples and large data-driven ones by providing a large sample with model-driven stellar parameters and a quantified selection function, enabling demographic studies of solar twins.
Key words: stars: abundances / stars: fundamental parameters / Hertzsprung-Russell and C-M diagrams / stars: solar-type-stars: statistics / Galaxy: evolution
The Tokyo Center For Excellence Project, Tokyo Metropolitan University.
© The Authors 2026
 Open Access article, published by EDP Sciences, under the terms of the Creative Commons Attribution License (https://creativecommons.org/licenses/by/4.0), which permits unrestricted use, distribution, and reproduction in any medium, provided the original work is properly cited.
This article is published in open access under the Subscribe to Open model. This email address is being protected from spambots. You need JavaScript enabled to view it. to support open access publication.
1 Introduction
Solar twins are defined as stars with stellar parameters (i.e., effective temperature, Teff; surface gravity, log g; and metallicity, [M/H]) very close to those of the Sun (Hardorp 1978; Cayrel de Strobel et al. 1981)1. By performing differential analyses between stars with very similar stellar parameters - solar twins in our case - one can achieve an extremely high accuracy in the measurements of stellar parameters and chemical abundances because systematic biases associated with Teff and log g are reduced (Bedell et al. 2014; Nissen & Gustafsson 2018). Such very precise and accurate determinations, which are sometimes combined with precise parallaxes, can also yield accurate stellar ages through isochrone modeling (e.g., Nissen 2015; Spina et al. 2016a), even though solar twins are main-sequence stars, for which isochrones of different ages are closely spaced in the Hertzsprung-Russell (HR) diagram.
By exploiting these advantages, solar twins have been used, for example, to determine such solar properties as its color (Holmberg et al. 2006; Casagrande & VandenBerg 2018), to study planet-host interactions through photospheric chemical abundances (Israelian et al. 2004, 2009; Meléndez et al. 2009), to construct chemical clocks (Tucci Maia et al. 2016; Casali et al. 2020), and to investigate the chemodynamical evolution of the Milky Way (Jofré et al. 2017; Bedell et al. 2018; Tsujimoto 2021). Among these applications, the ability to determine accurate stellar ages is particularly valuable for Galactic archaeology, where ages are crucial for tracing the history of the Milky Way but are often difficult to obtain (e.g., Ness et al. 2019; Magrini et al. 2023).
There have been great efforts to identify solar twins. In early studies, solar twins in a narrow sense, i.e., stars whose stellar parameters are identical to the solar values within the errors, were explored. In that era, only a few very similar solar twins were spectroscopically confirmed: 18 Sco (Porto de Mello & da Silva 1997; Soubiran & TrPrsa2016d 2004), HD 143436 (King et al. 2005), HD 98618 (Meléndez et al. 2006), HIP 100963 (Takeda et al. 2007), and HIP 56948 (Meléndez & Ramírez 2007; Takeda & Tajitsu 2009); see also the review by Cayrel de Strobel (1996). Later, motivated by these identifications and by the growing interest in understanding planet-host interactions, several dedicated surveys of solar twins were conducted, yielding samples of several tens of solar twins (e.g., Takeda et al. 2007; Meléndez et al. 2009). In particular, archival spectral data obtained with the HARPS spectrograph (Mayor et al. 2003), originally collected for exoplanet detection via radial-velocity monitoring, have been extensively used to derive high-precision chemical abundances and the ages of solar twins through differential analysis of high signal-to-noise-ratio (S/N) stacked spectra (e.g., Nissen 2015; Martos et al. 2025). Furthermore, recent massive spectroscopic surveys are capable of identifying thousands of solar twins. Nevertheless, only a few large samples of solar twins have been published so far. For example, Walsen et al. (2024) and Lehmann et al. (2025) used GALAH DR3 and Rampalli et al. (2024) used Gaia DR3 Radial Velocity Spectrometer (RVS) data. In the present contribution, our aim is to build a large catalog of solar twins based on non-data-driven stellar parameters as well as with strict filtering and a well-characterized selection function.
To obtain the largest possible catalog of high-quality solar twin candidates, the most effective approach is to mine the catalogs published by large spectroscopic surveys, though this is at the expense of some loss in precision compared to dedicated surveys targeting individual objects. The largest such catalog in terms of sample size (by more than one order of magnitude compared to ground-based surveys) is the homogeneous General Stellar Parametrizer from Spectroscopy (GSP-Spec) catalog collected from space by the ESA/Gaia mission and published as part of the third Gaia data release (DR3; Gaia Collaboration 2016, 2023c; Recio-Blanco et al. 2023). The GSP-Spec catalog is based on the analysis of ~5.6 million Gaia/RVS stellar spectra for which the main atmospheric parameters are provided, together with the mean enrichment in α-elements with respect to iron ([α/Fe], in dex) and individual chemical abundances of up to 13 elements (including two ions for iron). With the magnitude limit of G ≲12 for solar-type stars with the best GSP-Spec parameterization, GSP-Spec solar twins extend out to distances of ~300pc. This reachable distance is about three times larger than that of high-precision dedicated spectroscopic surveys, which typically reach ~ 100 pc. Hence, the volume covered, and therefore the expected number of objects, is increased by a factor of ~30.
This paper is organized as follows. We first discuss how we selected thousands of solar twins found in the GSP-Spec catalog (Sect. 2). Then, we describe how by comparing their stellar parameters and Gaia parallaxes with theoretical isochrones we determined their ages and initial masses in a homogeneous and consistent way (Sect. 3). We validated the resulting ages (Sect. 4), and we placed our work in the context of previous solar twin studies (Sect. 5). In the final section of the paper, we take a brief look at several applications of our catalog to assess its scientific potential (Sect. 6).
2 Solar twin selection
2.1 GSP-Spec sample of solar twin candidates
To look for robustly parametrized solar twins within the GSPSpec catalog, we first considered the approximately two million stars whose first 13 GSP-Spec quality flags (flags_gspspec) are all equal to zero. The flags refer to the quality of the Teff, log g, [M/H]2, and [α/Fe] derivations. The flags mostly depend on the quality of the input RVS spectra, and “0” means “best quality” (see, Sect. 8 of Recio-Blanco et al. 2023, for more details). The seventh digit of the quality flag indicates the uncertainty of the parameterization, and “0” means that the statistical uncertainties on Teff, log g, [M/H], and [α/Fe] are less than 100 K, 0.2, 0.1 dex, and 0.05 dex, respectively. Further, we selected stars with a very high quality GSP-Spec goodness of fit (logchisq_gspspec), log χ2 < -3.2, ensuring the high quality of the parameterization.
We also imposed the following criteria to analyze only stars with good astrometric solutions and to remove possible binary stars: The renormalized unit weight error (RUWE) is smaller than 1.4, the astrometric_params_solved is 0, the duplicated_source is “False,” and non_single_star is 0. We confirmed that the fidelity_v2 index introduced by Rybizki et al. (2022) is larger than 0.5 for all the selected solar twin candidates, indicating that the quality of the astrometric solution is good.
We then calibrated log g and [M/H] for these stars, by following the relations as a function of Teff provided in Recio-Blanco et al. (2024). The applied corrections imply changes of ~0.1-0.2 for log g and <0.01 dex for [M/H]. We further calibrated the stellar parameters so that they are well differential against the Sun (see Appendix A)3. In short, for Teff and [M/H], we added offsets of 1 K and 0.062 dex, respectively. For log g, we applied Equation (A.3). Hereafter, we call the stellar parameters after the calibration described in Appendix A the “calibrated” parameters and use them unless otherwise specified, while we refer to the parameters before this second calibration as the “original” ones, though they have already been subjected to the first-stage calibration following Recio-Blanco et al. (2024).
With the zero-point biases reduced, the 7918 solar twin candidates were defined as having their Teff, log g, and [M/H] within ±200 K, ±0.2, and ±0.1 dex around the solar values, respectively. In the following, we adopted the standard solar values: Teff,⊙ = 5777 K, log g⊙ = 4.44, and [M/H]⊙ = 0.0dex. The typical parameter uncertainties are much smaller than the abovementioned filtering: for these 7918 candidates, their median uncertainties are actually equal to 50 K, 0.054, and 0.03 dex for Teff, log g, and [M/H], respectively.
2.2 Interstellar extinctions
Since the absolute magnitudes of all these solar twins are necessary for their accurate age determination, we computed their interstellar extinctions in the Gaia G-band by comparing their Gaia observed colors (GBP - GRP) to theoretical ones estimated from the Casagrande et al. (2021) relation between atmospheric parameters and color. For that relation, we adopted the “original” spectroscopic atmospheric parameters. These computations were performed for 1000 Monte-Carlo realizations, propagating the uncertainties on each atmospheric parameter and Gaia magnitudes in the different bands. The adopted extinctions (AG) are the medians of the Monte-Carlo distributions, and their associated uncertainties are half of the difference between the 84th and 16th percentiles, as it corresponds to a 1σ uncertainty for a normal distribution. The extinctions to our solar twins are small, with the median and 95th percentile of 0.02 and 0.15 mag, respectively, in the G band. We refer to de Laverny et al. (in prep.) for more details on these extinction calculations and to Barbillon et al. (2025) for their validation in a Galactic and interstellar-medium context.
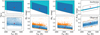 |
Fig. 1 Some parameters of theoretical isochrones (top) and observed solar twin candidates (bottom). The horizontal axes in all the panels represent Teff, while the vertical axes represent some other parameters (log g, MG, MKs, and (J - Ks)⊙). Cyan dots in the upper panels show the isochrone grid points satisfying −0.1 < [M/H]curr < +0.1 dex. Blue dots in the upper panels show a subset of them having Teff and log g between ±200 K and ±0.2 around the solar values, which is the selection criterion of our solar twin candidates in Sect. 2.1 and is represented as a rectangle outlined with black dashes in the left panels. The trapezoids outlined in black dashes in the rest of the panels show the selection criteria for good solar twins in Sect. 2.4. Dots in the lower panels show the parameters of the 7775 observed solar twin candidates with good distances and 2MASS data. Orange dots in the lower panels show a subset of solar twins that do not satisfy the selection criteria (i.e., outside of the trapezoids). Red crosses show the reference solar values provided in Sect. 4.1 and (J - Ks)⊙ = 0.40 (Willmer 2018). We note that several outliers of observed solar twin candidates fall outside the plotted range and are not shown in the figures. |
2.3 Absolute magnitudes and de-reddened colors
We retrieved the Gaia DR3 photometry (phot_g_mean_mag, phot_bp_mean_mag, and phot_rp_mean_mag) of the solar twin candidates from the Gaia Archive. Their 2MASS JHKs photometry (Cutri et al. 2003; Skrutskie et al. 2006) was extracted using the cross-matched result in the gaiadr3.tmass_psc_xsc_best_neighbour catalog. We then converted the G-band extinction AG determined in Sect. 2.2 to the extinctions in the Gaia EDR3 and 2MASS passbands using the DUSTAPPROX code (Fouesneau et al. 2022). Then, combining these extinctions with the distances from Bailer-Jones et al. (2021), we calculated the absolute magnitudes and de-reddened colors of the solar twin candidates.
2.4 Flagging with absolute magnitudes
In order to further clean our sample, we made use of the absolute magnitudes and de-reddened colors computed in Sect. 2.3 together with PARSEC isochrones retrieved in Sect. 3.1 and interpolated in Appendix B. From the 7918 solar twin candidates, we removed stars falling under any of the following conditions from the subsequent analysis:
Stars without a 2MASS entry in the JKs bands (41 stars);
Stars whose 2MASS counterpart is not uniquely matched, i.e., it also matched another solar twin candidate (2 stars);
Stars with the Qflg in the 2MASS JKs bands of E, F, U, X, or Z (i.e., poor photometry; 100 stars).
These conditions left 7775 stars with good distances and 2MASS data.
We found that some of the solar twin candidates have absolute magnitudes and/or de-reddened colors that are far from those of the Sun. For example, some stars have absolute G - and Ks -band magnitudes that are systematically higher (or lower) than the solar values (orange dots in lower middle panels of Fig. 1). Such systematic deviations, regardless of wavelength, indicate either poor parallax, poor log g determination, and/or binarity. As another example, some other stars have their dereddened J - Ks colors far from the solar value (orange dots in lower right panel of Fig. 1). Regardless of the reason for such deviation (e.g., poorer image FWHM in 2MASS than in Gaia), such stars should be treated with caution given that we used the 2MASS Ks magnitude in one of our age-determination methods.
To exclude stars having unexpected absolute magnitudes and/or de-reddened colors, we plotted log g, MG, Mks, and ( J -Ks)⊙ against Teff in the lower panels of Fig. 1. In order to select solar twin candidates having good absolute magnitudes, we first gathered isochrone points having current metallicity [M/H]curr, Teff, and log g within ±0.1 dex, ±200 K, and ±0.2 around the solar values (blue dots in the upper panels), which is equivalent to our selection criterion for solar twin candidates in Sect. 2.1. Then, in the Teff vs MG and Teff vs MKs diagrams, we drew trapezoids that provide a near-minimal enclosure of the selected sample (black-dashed trapezoids). Finally, the two trapezoids were used to remove 1129 suspicious candidates.
In contrast to the absolute magnitudes of theoretical solar twins, which show a spread of ~1mag, their (J - Ks)⊙ colors follow a very tight Teff-color relation with a spread of ~0.01 mag (upper right panel of Fig. 1). Hence, the observed color spread of solar twin candidates is dominated by the photometric error of ~0.03 mag, which is larger than the intrinsic absolute-magnitude spreads. We also found that the solar color of 0.40 (Willmer 2018) deviates from the isochrones by 0.04 mag. As such, it is practically impossible to select good solar twin candidates using the theoretical (J - Ks)⊙ colors. Instead, we removed 52 candidates by excluding stars that clearly lie outside the main locus in the diagram, using a rectangular selection box of 0.16 mag width chosen based on visual inspection.
With all the conditions listed in this section considered, there remain 6594 stars. They are good solar twins suitable for the subsequent analysis.
2.5 Orbital parameters
Since orbital parameters of solar twins are useful for discussing their origins, we computed their dynamical properties as in Gaia Collaboration (2023b) and Palicio et al. (2023). In particular, we considered the guiding radius by numerically solving |Lz| = RgVcirc(Rg), where Lz is the angular momentum and Vcirc(R) is the circular velocity at radii R. For these orbit determinations, we adopted the Gaia coordinates, geometric distances from Bailer-Jones et al. (2021), Gaia DR3 radial velocities (Vrad; Katz et al. 2023), and Gaia EDR3 proper motions, together with a local standard of rest (LSR) velocity at the Sun’s position equal to VLSR = 238.5 km s−1 (Schönrich et al. 2010), and a Galactic center distance of R0 = 8.249kpc (GRAVITY Collaboration 2020). The determined orbital parameters are used in our companion papers (Papers II and III; Tsujimoto et al. 2026; Taniguchi et al., in prep.).
3 Age determination of the solar twins
We computed the ages of solar twins having precise Gaia stellar parameters by adopting the so-called isochrone method, which has been widely used for dating stars including solar twins (e.g., Jørgensen & Lindegren 2005; Ramírez et al. 2014; Spina et al. 2018). Basically, our methodology consists of an adaptation of those of Zwitter et al. (2010) and Kordopatis et al. (2023), with optimization for solar twin ages. As we detail in this section, we determined the ages using three combinations of parameters: Teff, [M/H], and either log g, G-band absolute magnitude, or Ks-band absolute magnitude.
3.1 PARSEC isochrone library
As the isochrone library used in the subsequent analysis and in Sect. 2.4, we retrieved PARSEC isochrones version 1.2S (Bressan et al. 2012; Chen et al. 2015) using the CMD 3.7 web interface5. We used the “YBC+new Vega” bolometric corrections (Chen et al. 2019; Bohlin et al. 2020) to obtain photometric magnitudes in the 2MASS (Cohen et al. 2003) and Gaia (Riello et al. 2021) wavelength passbands.
For the ages of the isochrones, we considered two grids of ages: a logarithmically evenly spaced age grid between 108.0−108.95 yr with 0.05 dex increments and a linearly evenly spaced age grid between 1-20 Gyr with 0.1 Gyr increments. The former was considered to densely populate the HR diagram with isochrone grids, given that isochrones of young massive stars move quickly on the HR diagram. The latter was considered to determine the ages and accompanying errors as precisely as ~0.1 Gyr. The two grids are almost continuously connected at 1 Gyr; in other words, the step size of the former grid at 1 Gyr of 0.05 ln 10 ~ 0.1 Gyr is very similar to the interval in the latter grid.
For the initial metallicity, we considered the range from −0.5 to +0.5 dex with increments of 0.005 dex6. The interval of the initial-metallicity grid is equal to the minimum error in [M/H] of our GSP-Spec solar twin sample.
In total, we retrieved (20 + 191) × 201 = 42411 isochrone tracks. We only considered isochrone grid points with labels “0” (pre-main-sequence), “1” (main sequence), or “2” (subgiant branch) to reduce the data size of the isochrone library. In the subsequent analysis, we used the following quantities tabulated in the isochrones: age, τ; initial mass, Mini; current surface metallicity, [M/H]curr7; Teff; logg; and absolute magnitudes in the Gaia EDR3 G-band and 2MASS JHKs-bands.
3.2 Bayesian age determination
As in several previous studies, we determined the age τ, initial mass Mini, and initial metallicity [M/H]ini using a Bayesian isochrone-projection method, weighting individual isochrone points. We used three sets of three observed quantities for the projection: Teff, [M/H]curr8, and one of the following three quantities: log g, G-band absolute magnitude, or Ks-band absolute magnitude. The use of [M/H]curr, rather than [M/H]ini, is necessary because atomic diffusion changes the surface metal-licity of a star from its initial metallicity and hence changes the determined ages with the amount depending on the evolutionary phase (Christensen-Dalsgaard et al. 1996; Nissen 2016; Dotter et al. 2017). Atomic diffusion is indeed implemented in the PARSEC model used here, and the surface metallicity (i.e., common logarithm of the surface Z/X plus an offset) decreased by ~0.1 dex almost steadily during the main-sequence lifetime of a 1 M⊙ model.
We calculated the weight, wi, of each isochrone grid point, i, as
![Mathematical equation: w_{i}\equiv p_{i}^{\tau }p_{i}^{M_{\mathrm{ini}}}p_{i}^{\mathrm{[M/H]}_{\mathrm{ini}}}\exp \left(-\sum _{k}\frac{(\theta _{i,k}-\theta _{k}^{\mathrm{obs}})^{2}}{2{\sigma _{\theta _{k}^{\mathrm{obs}}}}^{2}}\right)\text{,}](/articles/aa/full_html/2026/03/aa58913-26/aa58913-26-eq1.png) (1)
(1)
where k labels the three observed quantities;  ,
,  , and
, and ![Mathematical equation: $p_{i}^{\mathrm{[M/H]}_{\mathrm{ini}}}$](/articles/aa/full_html/2026/03/aa58913-26/aa58913-26-eq4.png) represent factors corresponding to priors; θi,k represents the value for the quantity k in the isochrone library; and
represent factors corresponding to priors; θi,k represents the value for the quantity k in the isochrone library; and  and
and  represent the point estimate and accompanying error in the observed quantity k. Since solar twins are located in a narrow region of stellar parameter space, we assumed flat priors in τ, Mini, and [M/H]ini. Thus, the factors
  ,
,  , and
, and ![Mathematical equation: $p_{i}^{\mathrm{[M/H]}_{\mathrm{ini}}}$](/articles/aa/full_html/2026/03/aa58913-26/aa58913-26-eq9.png) were set to the increments of the corresponding values in the isochrones. For example, since we retrieved an isochrone library sampled on a linear grid in [M/H]ini, the value of
were set to the increments of the corresponding values in the isochrones. For example, since we retrieved an isochrone library sampled on a linear grid in [M/H]ini, the value of ![Mathematical equation: $p_{i}^{\mathrm{[M/H]}_{\mathrm{ini}}}$](/articles/aa/full_html/2026/03/aa58913-26/aa58913-26-eq10.png) is constant across all isochrone points. The calculated weights assigned to individual isochrone points represent the discrete posterior distribution of the output quantities (τ, Mini, and [M/H]ini).
is constant across all isochrone points. The calculated weights assigned to individual isochrone points represent the discrete posterior distribution of the output quantities (τ, Mini, and [M/H]ini).
We note that in cases where the “calibrated” log g precision is smaller than 0.005 (46 stars), we assigned an uncertainty of 0.005 in calculating the weights, which corresponds to the minimum allowed error value in the “original” GSP-Spec catalog (i.e., those before the calibration in Appendix A), given that the logg_gspspec values are rounded to two decimal places. The maximum log g step in our isochrone grid is ~0.003 (Appendix B), which is smaller than the minimum assigned log g uncertainty of 0.005, and is therefore sufficiently fine to accurately project log g onto τ and Mini. Similarly, we assigned an uncertainty of 0.005 dex to [M/H] values with reported uncertainties smaller than 0.005 dex (four stars)9. Since the maximum step sizes of our isochrone grid are ~4 K, 0.01 mag, and 0.01 mag for Teff, MG, and MKs, respectively (see, Appendix B), we adopted these values as uncertainties when the quoted observational errors were smaller (0, 2745, and 0 stars, respectively).
To obtain the point estimates of the output quantities, we generated 106 Monte Carlo samples with replacement, where each sample i was selected with a probability proportional to its weight wi. Since the isochrone library is discrete, the Monte Carlo samples drawn from them are also discrete. To recover continuity, we added Gaussian noise to each sample with standard deviations of 0.1 Gyr, 0.001 M⊙, and 0.005 dex for τ, Mini, and [M/H]ini, respectively, reflecting typical isochrone increments. We then adopted the 50.0, 15.8, and 84.2 percentiles as the median and 1σ uncertainties.
4 Validation of the age determination
We have published the full catalog of solar twins (Table E.1) at the Strasbourg astronomical Data Center (CDS). Column descriptions are provided in Table E.2. In this section, we validate the determined ages in two ways: by testing whether we recover the age of the Sun (Sect. 4.1) and by comparing our observed catalog to a mock solar twin sample (Sect. 4.3). We also take a look at the determined age and Mini (Sect. 4.2). We then discuss which of the three age estimates, i.e., those determined from log g, MG, and MKs, should be preferred in practice (Sect. 4.4).
4.1 Age of the Sun
The age of the Sun has been measured precisely using both helioseismology (Dziembowski et al. 1999; Bonanno et al. 2002; Houdek & Gough 2011) and radiometric dating of meteorites (Patterson 1956; Amelin et al. 2002; Bouvier & Wadhwa 2010). These studies concluded that the age of the Sun (or the solar system) is ~4.5-4.6 Gyr. Here, we apply our agedetermination procedure to the Sun and check whether we can recover this age. We note that PARSEC isochrones version 1.2S were calibrated to reproduce solar stellar parameters at an age of 4.593 Gyr (Table 3 of Bressan et al. 2012), and thus our procedure should accurately recover the solar age if our implementation is correct.
As inputs for the solar parameters, we adopted MG,⊙ = 4.66 (see, Creevey et al. 2023, which adopt the solar bolometric absolute magnitude Mbol,⊙ = 4.74 from Prsa et al. 2016) and MKs,⊙ = 3.27 (Willmer 2018). We also used reference solar values given in Sect. 2.1, namely, Teff,⊙ = 5777 K, log g⊙ = 4.44, [M/H]curr,⊙ = 0.0 dex, and [α/M]curr,⊙ = 0.0 dex. The uncertainties in the input values were assumed to be 0.01 mag for MG,⊙ and MKs,⊙, 4K for Teff,⊙, 0.005 for log g⊙, 0.005 dex for [M/H]curr,⊙, as in Sect. 3.2 for cases with very small errors.
The recovered solar age is summarized in Table 1. We found that the recovered solar age is consistent with the literature value in all cases where log g, MG, or MKs is used as input. We also found that the recovered solar Mini is consistent with 1 M⊙.
As expected, the recovered solar [M/H]ini is 0.08 dex (or 0.06 dex when adopting the zero-point used for [M/H]curr), which is higher than the solar surface value by ~10σ. This offset reflects the decrease in surface metallicity with age in the 1 M⊙ PARSEC model at a rate of ~0.015 dex Gyr−1. This level of atomic diffusion has been supported by homogeneous spectroscopy of cluster stars; for example, in the solar metallicity, solar age open cluster M67 (Bertelli Motta et al. 2018; Souto et al. 2019; Liu et al. 2019).
For comparison, we also determined the age of the Sun under the assumption that the observed [M/H] is equal to [M/H]ini. In that case, the recovered age is  ,
,  , or
, or  when using log g, MG, or MKs, respectively. As expected, these values deviate significantly from the true solar age, demonstrating the importance of treating [M/H] and atomic diffusion consistently when determining ages.
Recovered age, Mini, and [M/H]ini of the Sun.
4.2 Overview of the determined solar twin parameters
Figure 2 shows the scatter plots between the age and initial mass Mini for our solar twin catalog. If the isochrone library retrieved from the CMD 3.7 web interface were used without further interpolation, stars would concentrate at discrete Mini values, producing strip-like density patterns corresponding to the coarse initial-mass grid (0.05M⊙ spacing). In contrast, thanks to the fine interpolation of the PARSEC isochrones described in Appendix B, no such artificial striping is visible in our results.
Our solar twins occupy a limited region in the age-Mini plane in two respects. First, the Mini values lie within ~0.9-1.1 M⊙, reflecting the fact that we only analyzed solar twins, i.e., main-sequence stars around the solar Teff. Second, there are no stars in the upper-right region (older and more massive stars). Stars in that region would have already evolved off the main sequence; for example, the main-sequence lifetime of a 1 M⊙ star is ~ 10 Gyr (Kippenhahn et al. 2013).
There is also a strong dependence of the relative age error on age and Mini. Older stars and stars with higher Mini have smaller relative age errors. These stars lie more closely to the main-sequence turn-off, where isochrones move rapidly on the HR diagram, and hence ages can be more tightly constrained. Within this general trend, the decrease in relative age error toward older ages is clearly seen for the MG -based and MKs-based ages, but it is less apparent for the log g-based ages, especially at young ages, where the behavior appears more scattered. This difference may be related to the calibration of log g (Appendix A), in which the original-calibrated relation becomes nearly flat at high log g (i.e., for young stars). This flattening can reduce the propagated calibrated log g uncertainties for young stars and may affect the relative age errors derived from log g.
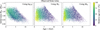 |
Fig. 2 Recovered parameters in the resulting observed solar twin catalog. Each panel shows a scatter plot between the determined age, τ, and initial mass, Mini, color coded by the relative age error. Left, middle, and right panels show the results obtained when using log g, MG, and MKs, respectively. as the third input parameter in addition to [M/H]curr and Teff. |
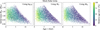 |
Fig. 3 Recovered parameters in the mock catalog of solar twins. We show only random 6594 mock stars, i.e., the same number of stars as in the observed solar twin catalog. All the panels are defined in the same way as in Fig. 2. |
4.3 Comparison with mock solar twins
As we saw in Sect. 4.2, there are selection effects in our solar twin catalog. Any analysis based on the catalog needs to account for selection effects and the distribution of age errors. To facilitate this, we here constructed a mock solar twin catalog that mimics our observed selection function (Sect. 4.3.1), and then compared the observed and mock samples (Sect. 4.3.2).
4.3.1 Creation of a mock solar twin sample
We constructed a mock sample of solar twins as follows. First, we sampled stars across the age-Mini grid points of the PARSEC isochrone library used in Sect. 3 for age determination. At each grid point, stars were sampled from an uniform distribution in age and [M/H]ini, with a density of 4 × 10⁸ stars Gyr−1 dex−1. This corresponds to, for example, for ages > 1 Gyr, where the grid spacing is 0.1 Gyr in age and 0.005 dex in [M/H]ini (Sect. 3.1), 4 × 10⁵ stars per grid point.
The initial mass Mini of each star was sampled from the Kroupa (2001) initial mass function (IMF). The distance D to each star was sampled between 20-350 pc assuming an uniform underlying spatial density, corresponding to a probability distribution proportional to D2. Other stellar parameters (i.e., Teff, log g, [M/H]curr, and absolute magnitudes in the G and Ks bands) of each star were assigned by interpolating the PARSEC isochrones.
The α abundance [α/Fe] was assigned using the linear age-[Ca/Fe] relation from Bedell et al. (2018), because GSP-Spec [α/Fe] closely tracks [Ca/Fe] (Recio-Blanco et al. 2023, 2024). We then computed an “observed” [M/H] value, i.e., without correcting for the effect of [α/Fe] on the isochrones using the equation from Salaris et al. (1993).
Sky coordinates were assigned assuming an uniform distribution over the celestial sphere. G-band extinction AG was estimated using the 3D dust map of Leike et al. (2020) as implemented in the dustmaps code (Green 2018; Green et al. 2019), and the apparent G-band magnitude was then computed. Because the 3D dust map of Leike et al. (2020) has a finite spatial coverage of 740 pc × 740 pc × 540 pc, some mock stars between 270-350 pc fall outside the map and therefore have an undefined AG. For such stars, new sky coordinates were repeatedly assigned until AG could be estimated.
Given the apparent G-band magnitude, we then assigned S/N and observational uncertainties according to Equations (C.1) and (C.2), respectively, adding Gaussian scatter to reproduce the observed dispersion around these relations (see, Appendix C for more details).
Finally, we applied to the noise-added mock catalog the same selection criteria used for the real solar twins. That is, we required Teff, log g, and [M/H] to be close to the solar values (Sect. 2.1), small errors in these parameters and in [α/Fe] (Sect. 2.1), and consistency of MG and MKs as being solar twins (Sect. 2.4). In this way, selection effects such as the Malmquist bias are embedded in the mock sample.
This procedure yielded a mock solar twin catalog consisting of 75 588 artificial stars, more than ten times the size of the observed solar twin sample (6594 stars). We note that the number of stars passing the selection depends on age. For example, the number of selected stars with ages between 10-11 Gyr is ~2.5 times smaller than that with ages between 5-6 Gyr, because the range of Mini values satisfying the solar twin selection criteria becomes narrower at older ages. We then determined the ages of these mock stars using exactly the same procedure as for the observed stars in Sect. 3.2.
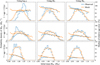 |
Fig. 4 Comparison between the observed (blue) and mock (orange) solar twin catalogs in different age bins. Top, middle, and bottom panels show results for twins with the determined ages between 1-2, 4-5, and 7-8 Gyr, respectively. Left, middle, and right panels correspond to ages determined using log g, MG, and MKs, respectively, as the third input parameter together with [M/H]curr and Teff. In each panel, the histograms show the probability density of the initial mass Mini (i.e., the normalized number of twins per Mini bin), while line plots show the median relative age errors in each Mini bins. |
4.3.2 Comparison of observed and mock solar twins
Figure 3 shows the scatter plots between age and Mini of for the mock solar twin catalog. In this figure, we display only 6594 stars randomly drawn from the full set of 75 588 mock twins, so that the number of plotted stars matches that of the observed sample in Fig. 2. We found that the overall shape of the distribution and the dependence of relative age error on age and Mini are very similar between the observed and mock samples, confirming the overall good accuracy in our solar twin catalog.
The observed catalog contains fewer old stars (≳ 10 Gyr) than the mock catalog. This difference likely reflects the underlying age distribution: we assumed a flat age distribution in the mock sample, whereas the observed sample may have a nonflat age distribution due to the star-formation history and radial migration. This topic is investigated in detail in our companion paper (Paper II; Tsujimoto et al. 2026).
To assess our solar twin catalog more closely, we divided both the observed and mock samples into 1 Gyr age bins and examined the solar twin mass function, i.e., the number of solar twins at each Mini within a given age bin. Given the relatively narrow age bins, the mass function should be similar between the observed and mock samples as long as the assumed IMF and stellar-evolution model are accurate and the efficiency of radial migration does not depend strongly on stellar mass.
Histograms in Fig. 4 show the solar twin mass function for the observed (blue) and mock (orange) samples. For the ages determined using MG or MKs (middle and right panels, respectively), the observed and mock histograms are nearly identical in shape. This agreement suggests that our determinations of age and Mini based on MG or MKs are accurate. In contrast, the histograms for ages based on log g (left panels) show significant differences, especially at younger ages (top and middle panels). This discrepancy could be due to a residual systematic bias in log g, which we discuss in Sect. 4.4.
We also examined the median relative age error in each Mini bin for each age bin as a function of Mini (line plots in Fig. 4; again, blue for the observed sample and orange for the mock sample). At high mass (Mini ≳ 0.95 M⊙), the observed and mock age errors behave similarly, confirming that the error prescriptions in the mock sample well reproduce those in the observed sample. At lower masses, however, we found differences in the median relative age error of up to ~20%. Detailed comparisons between the observed and mock samples revealed that this difference arises from the dependence of metallicity on the distance present in the observed sample. In the observed catalog, there is a weak tendency for metal-rich stars (within our narrow metallicity range of ±0.1 dex around the solar value) to lie at larger distances (and hence to have a lower S/N and larger errors), regardless the direction, though the origin of this trend is unclear. No such trend appears in the mock sample. Because, for Mini ≲ 0.95 M⊙, stars with higher metallicity do not satisfy the solar twin selection criteria due to the metallicity dependence of Teff, the lower-mass bins are dominated by lower-metallicity stars in the observed sample. These stars tend to lie at closer distances and therefore have smaller errors, resulting in smaller median relative age error for the observed sample than the mock sample at lower masses. This tendency should be kept in mind when analyzing our catalog.
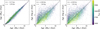 |
Fig. 5 Comparison between the solar twin ages determined with log g, MG, and MKs, color coded by Teff. |
4.4 Comparison of the three age determinations
Figure 5 compares the ages of solar twins determined using log g, MG, and MKs. As shown in the left panel, the ages derived from MG and MKs agree very well. The mean bias and standard deviation are −0.17 and 0.39 Gyr, respectively, both of which are much smaller than the typical age uncertainties of 2.8 and 2.2 Gyr for the MG- and MKs-based ages. This is expected because both MG and MKs are tied to the bolometric luminosity Lbol through the bolometric corrections implemented in the isochrone library (Chen et al. 2019; Bohlin et al. 2020), and hence both sets of ages are essentially determined by Teff, [M/H], and Lbol. In other words, the close agreement between MG- and MKs -based ages supports the accuracy of the adopted bolometric corrections.
A small number of outliers deviate from this one-to-one relation between MG and MKs-based ages, most of them having MKs -based ages larger than those from MG. Though the exact cause is unclear, unresolved multiplicity in 2MASS likely plays a role. Gaia photometry resolves these multiple systems that are unresolved in 2MASS due to its poorer spatial resolution. In such cases, the Ks magnitude could be biased by unresolved companions, making stars appear brighter and, hence, older in the MKs-based age estimates.
Middle and right panels of Fig. 5 show the ages based on log g against those based on MG and MKs, respectively. In both panels, there is a large scatter around the one-to-one line (1.64 and 1.81 Gyr, respectively), and the relation between the two age estimates depends on Teff. Since log g is related to Lbol via the Stefan-Boltzmann law, and we have already demonstrated the reliability of the bolometric corrections linking Lbol to MG and MKs, any model-related uncertainties would affect all three age estimates in a similar way. Hence, the scatter could be due to a Teff-dependent systematic bias in log g, which we could not fully correct in Sect. 2.1 and Appendix A.
As discussed in this section and in Sect. 4.3.2, a residual systematic bias in log g appears to remain despite our calibration efforts. This likely reflects the difficulty of determining spectroscopically log g accurately. Unlike absolute magnitudes, which can be determined accurately from photometry and astrometry when extinction is not severe, determinations of log g requires specific spectral features such as combinations of neutral and ionized lines from a specific element and/or the wings of very strong lines (Gray 2005). In our case, GSP-Spec log g is primarily constrained by the wings of the Ca II IR triplet, weak metallic lines, and molecular lines (Recio-Blanco et al. 2016), and the limited wavelength coverage associated to a medium spectral resolution of RVS makes the problem challenging. Indeed, we found a systematic trend between the original GSP-Spec log g estimates and literature log g values based on higher-resolution, wider-wavelength-coverage spectra (Appendix A). If a sufficiently large calibration sample densely covering the Teff-log g plane would have been available, this bias could be removed more accurately, but with only a few dozen stars in common, the calibration remains not enough accurate when examining tiny effects.
Given these difficulties in determining log g, we do not recommend using our log g-based ages for statistical analysis of the sample. In contrast, both the MG- and MKs-based ages appear sufficiently reliable for such applications. Either can be used, but MG-based ages have the advantage that Gaia offers higher spatial resolution, thereby reducing the risk of age overestimation due to unresolved companions. On the other hand, MKs-based ages are less sensitive to extinction. Since in our companion paper, Tsujimoto et al. (2026, Paper II), we adopted the MKs-based age for their analysis, for which selection effects are weaker, we also use the MKs -based ages in the subsequent discussion of this paper.
5 Comparison with previous solar twin catalogs
In this section, we first compare our solar twin catalog with literature, in particular focusing on the number of twins in each sample (Sect. 5.1). Then, we compare different sets of stellar parameters, ages, and Mini, to further validate our catalog and to place this work in the context of previous solar twin studies (Sect. 5.2).
5.1 Properties of the literature and this solar twin catalogs
Table 2 summarizes information on our catalog of solar twins along with that of a (comprehensive but not complete) compilation of literature studies based on high-resolution spectroscopy. We mostly included studies that determined stellar parameters by themselves and that mainly focused on solar twins (or at least solar analogs).
As shown in the table, most catalogs contain only a limited number of solar twins (typically several tens), but in some of these catalogs the stellar parameters are measured with very high precision, if we consider the reported uncertainties. Many recent catalogs are based on archival spectra from the HARPS spectrograph (Mayor et al. 2003), originally obtained for exoplanet searches. By stacking time series spectra, HARPS data provide an extremely high spectral resolution (R = 115 000) and S/N of ~1000 over most of its wide 378-691 nm wavelength range and hence extremely high precision in the derived stellar parameters and chemical abundances (e.g., 10 K in Teff, 0.02 in log g, and 0.01 dex in [Fe/H] and other abundances, in the work by Martos et al. 2025, see Table 2 for precisions in other studies). Such small but highly precise and accurate samples are particularly valuable for identifying stars whose parameters must be determined with high accuracy relative to the solar values. For example, “true” solar twins, defined as stars whose parameters are not only close to those of the Sun, as in ordinary solar twins, but effectively indistinguishable within very small uncertainties (e.g., ~ 10 K in Teff), have been sought for many years (e.g., Porto de Mello & da Silva 1997; Meléndez & Ramírez 2007). Another example is the search for solar siblings, i.e., stars whose ages and chemical abundances are identical to those of the Sun and therefore could have formed in the same star cluster as the Sun (e.g., Adibekyan et al. 2018). Since cluster-to-cluster dispersions (or azimuthal scatter) in chemical abundances are suggested to be of the order of a few hundredths of a dex (e.g., Freeman & Bland-Hawthorn 2002; Bellardini et al. 2021; Bhattarai et al. 2024, and references therein), searching for solar siblings (or, in other words, carrying out strong chemical tagging) requires this level of precision and accuracy in abundance determinations. In general-purpose spectroscopic surveys with moderate S/N, in contrast to high-precision solar twin studies, the achievable precision and accuracy for individual stars are still insufficient for this purpose (e.g., Casamiquela et al. 2021; Ness et al. 2022).
In contrast, our work and a few recent studies have constructed large samples by homogeneously exploiting recent huge datasets from general-purpose spectroscopic surveys: Gaia DR3 GSP-Spec in this study, Gaia DR3 RVS in Rampalli et al. (2024), and GALAH DR3 in Walsen et al. (2024) and Lehmann et al. (2025). Stellar parameters and chemical abundances of ~1700 solar twins from APOGEE DR16 were also used by Nibauer et al. (2021). Such samples are generally limited in wavelength coverage, spectral resolution, and/or S/N, and thus the achievable precisions and accuracies in stellar parameters are lower. For example, in our case with Gaia DR3 GSP-Spec, RVS spectra cover only 846-870 nm with R = 11 500, and the median S/N per pixel (rv_expected_sig_to_noise) is 8310. As a result, the precision of the derived stellar parameters degrades to 51 K in Teff, 0.05 in logg, 0.03 dex in [M/H], and ~0.1 dex in other abundances.
Nevertheless, the ~100 times larger sample size (6594 stars in our case), even with a lower precision, enables us to investigate the statistical properties of solar twins, such as the ageabundance relation, with comparable significance, as demonstrated in Sect. 6. Moreover, only such large samples allow us to study the density distributions of stellar parameters for solar twins, including the probability density of Mini at a given age (as shown in Fig. 4) and the probability density of ages (presented in our companion paper, Paper II; Tsujimoto et al. 2026).
To date, all previous large solar twin samples (Rampalli et al. 2024; Walsen et al. 2024; Lehmann et al. 2025) relied on data-driven approaches to determine stellar parameters and chemical abundances (see, Appendix D, for an in-depth review of their methods and results). As a result, they achieved internal precisions that are comparable to or higher than those in our GSP-Spec study, in which a traditional spectral-fitting technique was used. However, as a trade-off, some of their reported results may reflect correlations learned from the training data, since data-driven approaches infer, rather than directly measure, chemical abundances. Indeed, Rampalli et al. (2024) pointed out that their model inferred the abundances of C, O, Na, V, Al, and Y, even though no atomic lines of these elements with sufficient strengths are present in the Gaia RVS spectra of solar twins, and abundances of these elements are not included in the GSP-Spec catalog11. Further indications that data-driven inferences may be influenced by training-set correlations are discussed in Sects. 5.2 and 6.2. Catalogs with model-driven abundances therefore offer a complementary way to validate data-driven results.
In light of these previous large-sample studies of solar twins, all of which rely on data-driven methods, our catalog based on Gaia DR3 GSP-Spec aims to provide a large, homogeneous catalog in which all stellar parameters, age, and elemental abundances are determined from forward modeling based on stellar atmosphere and evolutionary models, rather than inferred solely through data-driven methods, thereby avoiding the propagation of trends learned from small training samples. In this way, we aim to provide a basis for confirming results previously obtained from small, high-precision samples (e.g., age-[X/Fe] relations) in a scaled, statistical manner, as demonstrated in Sect. 6. Moreover, our characterization of the selection function (Sect. 4.3) facilitates analyses that are sensitive to selection effects (e.g., the interpretation of histograms). Taken together, our catalog offers model-driven parameters with a characterized selection function, serving as a complementary reference to both small high-precision samples and large data-driven samples.
Beyond differences in the sample size and analysis methods, some of the previous studies adopted rather loose criteria on [M/H] when defining solar twins. For example, Lehmann et al. (2025) allowed stars with any [Fe/H] to be included in their sample. Such a loose criterion on [M/H] helps to investigate trends with metallicity and to enlarge the sample size without introducing large systematic uncertainties in chemical abundances. However, our strict criterion on [M/H], namely ±0.1 dex around the solar value, is essential for associating age with birth radius (Minchev et al. 2013; Plotnikova et al. 2024). With such a criterion, the age-[X/Fe] relation for solar twins can effectively provide information on the relation between birth radius and [X/Fe] at a given metallicity. Our moderately strict threshold on log g of ±0.2 dex around the solar value is also important for selecting only main-sequence stars, in contrast to some recent studies (e.g., ±0.3 dex around the solar value adopted by Walsen et al. 2024; Rampalli et al. 2024).
Solar twin catalogs adopted for comparison (incomplete manual compilation).
5.2 Comparison of stellar parameters, ages, and initial mass
Figures E.1 and E.2 show comparisons of stellar parameters (Teff, log g, and [M/H] or [Fe/H]), age, and Mini between this work and selected literature; Fig. E.1 for the studies used for the calibration of zero-points in Appendix A (Tucci Maia et al. 2016; Nissen et al. 2020; Shejeelammal et al. 2024) and Fig. E.2 for the studies building large catalogs using spectra from generalpurpose spectroscopic surveys (Rampalli et al. 2024; Walsen et al. 2024; Lehmann et al. 2025)12. We plotted only stars whose three parameters from both this work and the literature satisfy the solar twin criteria, regardless of their errors. We note that we plot the calibrated stellar parameters in these figures, rather than the original parameters shown in Fig. A.1.
In Fig. E.1, we found good agreement in all five parameters with those reported by Tucci Maia et al. (2016), Nissen et al. (2020), and Shejeelammal et al. (2024). The mean and standard deviation of the differences between our parameters and those from the literature are annotated in each panel. The agreement for the stellar parameters (Teff, log g, and [M/H]) is expected, given that we calibrated our stellar parameters against these three studies. The agreement for age and Mini supports the reliability of our isochrone projection. We found similar agreements with many other studies.
In contrast, we found discrepancies with several other studies, most notably those based on large solar twin samples, namely Walsen et al. (2024), Lehmann et al. (2025), and Rampalli et al. (2024), as shown in Fig. E.1. In the studies by Walsen et al. (2024) and Lehmann et al. (2025), [Fe/H] values are systematically 0.08 and 0.04 dex, respectively, lower than our [M/H], and hence the ages in Lehmann et al. (2025) are systematically 1.5 Gyr larger than ours. These systematic differences may be due to the fact that the two studies employed stellar parameters from GALAH DR3 and DR2, respectively, as training references for their data-driven analyses, which possibly have systematic zero-point biases, or at least zero points that differ from those in many high-precision solar twin studies13.
In our comparison with Rampalli et al. (2024), we found weak correlations between the two studies for logg, [M/H], and age14, even though both studies are based on Gaia DR3 RVS spectra. In particular, whereas our ages remain consistent with those from high-precision studies down to very young ages (≲1 Gyr; see Fig. E.1), the ages reported by Rampalli et al. (2024) show an apparent lower limit of ~2-3 Gyr. As a result, stars that we identify as very young solar twins are generally assigned significantly older ages in their study, contributing to the weak overall correlation. Because most of the stars analyzed by Rampalli et al. (2024) do not overlap with high-precision solar twin samples, it remains unclear whether the observed scatter in stellar parameters and age between our results and those by Rampalli et al. (2024) can be fully explained by the combined statistical uncertainties, or whether additional systematic uncertainties are present.
6 Age-chemical abundance trends
The precise and accurate chemical abundances of solar twins have been used to address various astronomical questions, from planet-host interactions to the chemodynamical evolution of the Milky Way (see, references in Sect. 1). [X/Fe] abundances, rather than [X/H], are particularly useful for these purposes, because the surface [X/Fe] ratios for most elements change by only <0.004 dex during main-sequence stellar evolution (Turcotte & Wimmer-Schweingruber 2002), which is markedly smaller than the change in surface [X/H] of ~10% (Christensen-Dalsgaard et al. 1996). To briefly assess the usefulness of our catalog, we here show results obtained using our ages and chemical abundances.
In our Gaia DR3 GSP-Spec catalog, abundance measurements are available for only a fraction of solar twins for most elements, with Ca being the exception, for which abundances are available for all twins. Restricting the analysis to stars with reliable abundance measurements, defined by the 14th-39th digits of the GSP-Spec Quality Flag corresponding to XUpLim≤2 and XUncer≤1, the resulting fractions are 0.70% for [N/Fe], 3.4% for [Mg/Fe], 49% for [Si/Fe], 17% for [S/Fe], 100% for [Ca/Fe], 3.8% for [Ti/Fe], 0.11% for [Cr/Fe], 90% for [Fe/M], and 1.5% for [Ni/Fe], in order of atomic number. The GSP-Spec [X/Fe] abundances used throughout this work were calibrated following Recio-Blanco et al. (2023, 2024). To complement the chemical information of our catalog, we cross-matched the Gaia DR3 source_id of our solar twins with those in APOGEE DR17 (Majewski et al. 2017; Abdurro’uf et al. 2022) and GALAH DR4 (De Silva et al. 2015; Buder et al. 2025) to obtain their abundance measurements, applying their recommended filtering. We also cross-matched these identifiers with the exoplanet data from NASA Exoplanet Archive (Christiansen et al. 2025)15 retrieved on August 13, 2025 (see, also de Laverny et al. 2025, for a catalog of exoplanet host stars with Gaia DR3 GSP-Spec). The retrieved APOGEE and GALAH abundances, as well as a flag indicating the presence or absence of confirmed exoplanets, are provided as part of our published solar twin catalog for reference (Table E.2).
Figure 6 shows the relations between the derived stellar ages and elemental abundances16. Here we show results only for four elements (Al, Si, Ca, and Y). These four elements are selected on the grounds that (i) [Al/Fe] and [Y/Fe] are known to show tight and steep correlations with stellar age (e.g., Sharma et al. 2022), and (ii) [Si/Fe] and [Ca/Fe] are measured for a relatively large number of stars with good precisions in our catalog. Results for the other elements available in our catalog are shown in Fig. E.3 for reference. To ensure reliable age estimates, we include only stars with relative age uncertainties better than 50%. This cut, which naturally excludes most of the young solar twins (≲2 Gyr) due to our selection effects (Sect. 4.3), is also beneficial because the stellar parameters of the youngest solar twins could be less accurate, owing to activity effects (Yana Galarza et al. 2019).
Age-abundance trends can serve as a diagnostic of the robustness and reliability of our age estimates, given that clear trends for solar twins have already been reported by Bedell et al. (2018, among others) using a small but high-precision sample. In addition, theoretical basis of these correlations can be understood within a framework that combines Galactic chemical evolution with radial migration of stars, in which the inner regions formed faster and became more metal-rich than the outer regions (Tsujimoto 2021). This view suggests that older solar twins were born at smaller Galactocentric distances, i.e., closer to the Galactic center, because all solar twins considered here have a common metallicity, nearly solar. On the basis of this picture, we emphasize that age and birth radius are tightly coupled. Hence, our age-[X/Fe] relations are not relations defined at a fixed Galactocentric distance, nor, of course, at a fixed age.
In the following, we discuss two topics regarding the age-[X/Fe] trends: slopes (Sect. 6.1) and s-enhanced solar twins (Sect. 6.2).
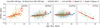 |
Fig. 6 Age-abundance relations for selected elements ([Al/Fe], [Si/Fe], [Ca/Fe], and [Y/Fe], from left to right). Blue dots show the GSP-Spec abundances of individual solar twins, while blue filled circles with error bars indicate the medians of [X/Fe] within each 1 Gyr age bin. Orange and green dots represent abundances from APOGEE DR17 (Majewski et al. 2017; Abdurro’uf et al. 2022) and GALAH DR4 (De Silva et al. 2015; Buder et al. 2025), respectively. The thick red line shows the linear age-abundance relation by Bedell et al. (2018) for comparison. Red filled circles and an open circle at 6.4 Gyr with error bars represent old α-enhanced stars and an s-enhanced star, respectively, from Spina et al. (2018) and Bedell et al. (2018). For each element from each survey, we applied a zero-point correction in [X/Fe] to make the abundance scale consistent with that of the age-[X/Fe] relation by Bedell et al. (2018). The ages are determined using the Ks-band magnitude, and only stars with relative age errors smaller than 50% are included. For APOGEE DR17 and GALAH DR4, we include only stars with abundance errors below 0.05 dex. We note that a small fraction of blue dots as well as one [Al/Fe] measurement from APOGEE DR17 and one [Al/Fe] measurement from GALAH DR4 fall outside the plotted range and are therefore not shown. Plots for all the elements are presented in Fig. E.3. |
6.1 Slopes of age-[X/Fe] trends
From Fig. 6, we found that the age-[X/Fe] relations in our catalog, regardless of which abundance source is adopted (Gaia DR3 GSP-Spec, APOGEE DR17, or GALAH DR4), show good agreement with the relations reported by Bedell et al. (2018) based on a small but very precise sample. In particular, for [Al/Fe] and [Y/Fe], whose age-abundance relations exhibit steep positive and negative slopes, respectively, our measurements reproduce the slopes obtained by Bedell et al. (2018) very well. These agreements support the reliability of our age determinations. Comparable agreement is also seen for most of the other elements shown in Fig. E.3. Although the uncertainties for individual stars in our catalog are relatively large, the consistency emerging from our much larger sample enables us to verify the age-[X/Fe] trends measured by Bedell et al. (2018) across a much larger solar twin sample.
The exceptions to this behavior are the age-[X/Fe] relations for [S/Fe] and [Ni/Fe] from Gaia DR3 GSP-Spec. Even though Bedell et al. (2018) presented positive age-[S/Fe] and [Ni/Fe] slopes, the age-[X/Fe] relations from GSP-Spec are rather flat for S and Ni. These flat trends from GSP-Spec are most likely due to selection effects (i.e., stars with a small [X/Fe], and hence weak lines of element X, tend to lack [X/Fe] measurements) given that the lines from S and Ni are very weak in solar-type stars in the RVS domain, although the presence of unknown systematic errors in the GSP-Spec abundances cannot be entirely ruled out. Below, we examine this possibility for S and Ni in more detail.
For [S/Fe], abundances from APOGEE DR17 indicate a positive relation with a slope of +0.0082 ± 0.0023 dex Gyr−1 (fitted using only solar twins with ages younger than 8 Gyr, to be consistent with the sample of Bedell et al. 2018), which is in good agreement with the slope of +0.0098 ± 0.0015 dex Gyr−1 by Bedell et al. (2018). GALAH DR4 does not provide [S/Fe]. Since S is an α element (e.g., Duffau et al. 2017; Perdigon et al. 2021, and references therein), the positive slope for [S/Fe] is expected, given that other α elements such as O and Mg also exhibit positive age-[X/Fe] trends. Nevertheless, because S sometimes exhibits behavior that differs from typical α elements (e.g., the negative radial [S/Fe] gradient seen in Cepheids; Luck 2018; da Silva et al. 2023), caution is warranted when treating S as a standard α element. Taken together, we conclude that the age-[S/Fe] relation likely has positive relation, expected from its α-element nature, and that the flat relation from Gaia DR3 GSP-Spec is probably due to selection effects.
For [Ni/Fe], when restricting ourselves to the stars plotted in Fig. 6 (i.e., stars with relative age errors smaller than 50%), APOGEE DR17 indicates a flat age-[X/Fe] relation within 1σ, and GALAH DR4 indicates a possibly positive but nearly flat relation within 2σ, seemingly contradicting the positive slope presented by Bedell et al. (2018). However, when we remove the constraint on the relative age error, and hence include stars with very young ages (≲2Gyr), we more or less recovered the age-[Ni/Fe] slope presented by Bedell et al. (2018) of +0.0071 ± 0.0009 dex Gyr−1, obtaining +0.0043 ± 0.0006 dex Gyr−1 from APOGEE DR17 and +0.0061 ± 0.0009 dex Gyr−1 from GALAH DR4 (again, including only stars with ages <8 Gyr). This is because, in APOGEE DR17 and GALAH DR4, stars with ages ≲3 Gyr have systematically ~0.02-0.03 dex lower [Ni/Fe] than older stars. We also see a similar age-[Ni/Fe] trend in Fig. 3 of Bedell et al. (2018), i.e., a nearly flat age-[Ni/Fe] relation for stars with ages ~2-8 Gyr and lower [Ni/Fe] for stars with ≲2 Gyr. In contrast, the Gaia DR3 GSP-Spec age-[Ni/Fe] relation is continuously flat (or even possibly negative) over the entire 0-10 Gyr age range. Therefore, we conclude that the age-[Ni/Fe] relation likely has a flat trend, as in other Fe-peak elements, at ≳2 Gyr, lower [Ni/Fe] at young ages, and that the flat Gaia DR3 GSP-Spec relation is again probably due to selection effects.
For several elements other than Ni (e.g., Mg, Co, and Sr), inspection of Fig. 3 of Bedell et al. (2018) suggests that the youngest solar twins (≲2Gyr) may exhibit slightly lower (or, for a few elements, slightly higher) [X/Fe] than would be expected from a linear extrapolation of the age-[X/Fe] relation of the older stars, as well as a larger dispersion than seen for the older stars, although this trend is not entirely clear. The apparent transition at an age of ~2Gyr, if real, coincides with the epoch of the recent star-formation peak (Mor et al. 2019; Ruiz-Lara et al. 2020; Tsujimoto et al. 2026). Such bursty star formation could have modified the relative contributions of type Ia and core-collapse supernovae and other nucleosynthetic sources, thereby altering the [X/Fe] ratios of solar twins younger than ~2Gyr (e.g., Tsujimoto et al. 1995; Johnson et al. 2021; Sun et al. 2025c), since the X-to-Fe yield ratios are expected to differ among sources. Whether such bursts drive [X/Fe] upward or downward is rather complicated, it depends on several ingredients such as the differences in nucleosynthetic [X/Fe] yields among sources, the star-formation history, and the subsequent mixing of metals, and it is therefore not straightforward to predict the exact trend. The physical trigger of the recent star-formation peak also remains under debate. Nonetheless, it is intriguing that the epoch of ~2Gyr ago coincides with the timing of possible external perturbations. For example, several studies have proposed that pericentric passages of the Sagittarius dwarf galaxy (Sgr) may have enhanced disk star formation (e.g., Ruiz-Lara et al. 2020; Annem & Khoperskov 2024). As another example, a recent sudden drop in [Fe/H] has been observed and interpreted as evidence of a low-metallicity gas infall event (Spitoni et al. 2023; Palla et al. 2024). Whatever the trigger of the bursty star formation, the resulting change in the relative contributions of nucleosynthetic sources might account for the departure of the young solar twins from a simple linear age-[X/Fe] extrapolation. Aside from such physical scenarios for the departure, systematic [X/Fe] errors associated with stellar activity in the youngest stars (Yana Galarza et al. 2019) could provide another contribution.
In light of the above discussion of [S/Fe] and [Ni/Fe], care should be taken when analyzing mean Gaia DR3 GSP-Spec abundances at the very high precision level of a few hundredths of a decimal exponent (dex), even though with Gaia DR3 GSP-Spec we succeeded in confirming the age-[X/Fe] trends by Bedell et al. (2018) for most elements. Larger, higher-precision samples are required to reach firm conclusions regarding the age-[X/Fe] trends. The GSP-Spec abundances in Gaia DR4 will be valuable in this context given the expected increase in S/N thanks to an observing duration roughly twice as long as that of DR3. At the same time, characterizing activity-related systematics will also be important for interpreting abundances at young ages.
6.2 s-process-enhanced stars
Other key findings by Spina et al. (2018) and Bedell et al. (2018) from the age-[X/Fe] plots are (1) higher [«/Fe] ratios for most stars with ages ≳8 Gyr than expected from a linear trend defined by stars with ages ≲8 Gyr, and (2) one star (HIP 64150) showing an anomalously high [s/Fe] ratio. Here we investigate the latter, s-enhanced stars in this section, while the former, α-enhanced stars are investigated in our companion paper (Paper III; Taniguchi et al., in prep.).
Spina et al. (2018) found that one star (HIP 64150) among their 79 solar twins shows an enhanced [s/Fe] ratio but not an enhanced [r/Fe]. As representative elements for the s- and r-processes, they measured [Y/Fe] = +0.267 and [Eu/Fe] = +0.041 dex, respectively. This [Y/Fe] value is +0.31 dex higher than the linear age-[Y/Fe] relation by Bedell et al. (2018), whereas [Eu/Fe] is only 0.01 dex smaller than the relation. Such enhancements in [s/Fe] with normal [r/Fe] have also been observed in two other solar analogs, with [Y/Fe] = +0.533 dex for HIP 1072517 (Schirbel et al. 2015) and [Y/Fe] = +0.92 dex for HD 13800418 (Liu et al. 2020). For HIP 64150 and HIP 10725, time variations in their radial velocities, most likely due to unseen white-dwarf companions, have been found (Schirbel et al. 2015; dos Santos et al. 2017, respectively), and pollution from a former AGB companion was suggested. For the last star, HD 138004, a radial-velocity variation of ~10kms−1 has been reported (Butler et al. 2017; Tal-Or et al. 2019). Combined with the astrometric acceleration measurements by Brandt (2018, 2021), this variation implies a companion with a mass of 0.658 M⊙ (An et al. 2025). The same technique was also applied to HIP 64150, yielding a companion mass of 0.603 M⊙ (An et al. 2025). We searched for other s-enhanced stars in the literature listed in Table 2, but no clear additional cases were found. If we relax the conditions on the stellar parameters for being solar twins, several probable s-enhanced solar analogs (2, 4, and 1 stars) appear in the samples from da Silva et al. (2012), Liu et al. (2020), and Shejeelammal et al. (2024), respectively, though these objects have large ages (≳10Gyr). Interestingly, Rampalli et al. (2024) published the [Y/Fe] abundances for 17412 solar twins (in their definition), but none of these stars has [Y/Fe] larger than 3σ (≃0.2dex) from their age-[Y/Fe] relation. This lack of s-enhanced stars might be related to the data-driven nature of their analysis and the lack of detectable s-process lines in Gaia RVS spectra of solar twins with low or moderate s-process enhancements (see Fig. 1 of Contursi et al. 2023 and Fig. 2 of Contursi et al. 2024 for Ce and Nd, respectively).
Using our catalog of solar twins, we searched for s-enhanced twins using GALAH DR4 [Y/Fe] abundances. We found that none of the 80 solar twins plotted in Fig. E.3 has a zero-point corrected [Y/Fe] value that is 0.2 dex or more above the age-[Y/Fe] relation by Bedell et al. (2018). There is one star (Gaia DR3 5365738724921515776) with a zero-point-corrected [Y/Fe] of 0.153 ± 0.022 dex, which is 0.199 dex higher than the relation by Bedell et al. (2018), but even in this case the enhancement in [Y/Fe] is modest. The absence (or presence of only one) s-enhanced star among our 80 stars could simply be due to smallnumber statistics, given that there is only one such star among the 79 solar twins of Bedell et al. (2018). However, it could also reflect our removal of possible binary stars as much as possible using Gaia flags and photometric constraints. To assess this possibility, we examined the absolute [Y/Fe] values for all solar twin candidates with GALAH DR4 [Y/Fe] abundances, without applying the astrometric and photometric criteria used to remove binaries in our final sample. We found that 3 out of 286 such stars (~ 1%) have [Y/Fe] values exceeding 0.2 dex, a fraction comparable to that found by Bedell et al. (2018), although this comparison is based on absolute [Y/Fe] values rather than offsets from the age-[Y/Fe] relation. This interpretation is also partly supported by the fact that the s-enhanced star HD 138004 is included in our parent Gaia sample but removed by its RUWE value and non_single_star flag, whereas another s-enhanced star, HIP 64150, passes our selection.
7 Summary
In this study, we have described how we constructed a large catalog of solar twins with isochrone ages using model-driven, rather than data-driven, Gaia DR3 GSP-Spec stellar parameters (Teff, log g, [M/H], and [α/Fe]). We selected candidate solar twins with high-quality GSP-Spec parameterization (Sect. 2.1). We required two quality criteria for GSP-Spec: The 13 first GSP-Spec Quality Flags are all equal to zero, and the goodness of fit satisfies log χ2 < -3.2. With these constraints, the uncertainties in the stellar parameters are smaller than 100 K in Teff, 0.2 in logg, 0.1 dex in [M/H], and 0.05dex in [α/Fe]. We calibrated the stellar parameters in two steps, first using the relations provided by Recio-Blanco et al. (2024) and then applying the corrections described in Appendix A, to place them on a scale consistent with high-resolution, high-precision spectroscopic results (Tucci Maia et al. 2016; Nissen et al. 2020; Shejeelammal et al. 2024). We then selected 7918 solar twin candidates whose Teff, log g, and [M/H] fall within ±200 K, ±0.2, and ±0.1 dex of the solar values, respectively. We filtered out stars with inaccurate parameterization and possible non-single stars as much as possible using RUWE; a few Gaia flags (astrometric_params_solved, duplicated_source, and non_single_star); and photometric constraints (Sects. 2.1 and 2.4 and Fig. 1). Applying these constraints yielded our final solar twin sample consisting of 6594 stars.
We determined the ages; initial masses, Mini; and initial metallicities, [M/H]ini, for individual solar twins with a Bayesian isochrone-projection method (Sects. 3.1 and 3.2). In this step, we employed the PARSEC isochrones version 1.2S (Bressan et al. 2012; Chen et al. 2015) obtained with the CMD 3.7 web interface. Because the native isochrone grid is too sparse to determine ages accurately for solar twins, we interpolated it to construct a sufficiently dense grid (Appendix B). Assuming flat priors on age, Mini, and [M/H]ini, we derived posterior estimates using three observable triplets: (Teff, log g, [M/H]curr), (Teff, MG, [M/H]curr), and (Teff, MKs, [M/H]curr).
We validated the resulting ages in two ways (Sect. 4). First, we applied our age-determination procedure to the Sun (Sect. 4.1 and Table 1). We confirmed that the recovered age and Mini agree with the literature values of 4.5-4.6Gyr and 1 M⊙ for all three age-determination schemes. Second, we constructed a mock solar twin sample consisting of 75 588 artificial stars (Sect. 4.3.1 and Appendix C) and compared its statistical properties with those of the observed sample (Sect. 4.3.2). Comparisons of the age-Mini distributions (Figs. 2 and 3) and the distribution of Mini at a fixed age (Fig. 4) showed good consistency between the observed and mock catalogs for ages based on MG or MKs. This fact supports the reliability of the GSP-Spec parameterization, our age determination, and the construction of the mock sample. In contrast, we found inconsistencies for ages derived from log g, likely reflecting the difficulty of determining enough accurate log g from the limited wavelength range of the Gaia RVS. Taken together with direct comparisons among the three age estimates (Fig. 5), we concluded that both MG-and MKs-based ages are reliable and hence suitable for statistical analyses. We adopted the MKs-based ages in our subsequent analysis (Sect. 4.4).
To place our catalog in the context of a decade of solar twin studies, we compared our solar twin catalog with earlier catalogs (Sect. 5). A comparison of basic metrics (Sect. 5.1 and Table 2) showed that some previous high-resolution solar twin samples contain only several tens of stars but achieve extremely high precision in Teff, logg, [Fe/H], and abundances. In contrast, our catalog and a few other recent works based on large spectroscopic surveys provide samples that are about two orders of magnitude larger but have worse precision regarding individual stellar parameters. While previous large solar twin catalogs (Rampalli et al. 2024; Walsen et al. 2024; Lehmann et al. 2025) rely on data-driven methods, our catalog is built from model-driven stellar parameters, ages, Mini, and chemical abundances. The reasoning behind this choice is to avoid propagating trends learned from training samples (i.e., previous small-scale datasets) and to verify the results obtained from past high-precision studies using our lower-precision but substantially larger sample. We adopted a strict criterion of ±0.1 dex around solar [M/H] to ensure that our solar twins are main-sequence stars with near-solar metallicity and that their ages can be tightly linked to their birth radii. Moreover, our construction of the mock sample is valuable for characterizing the selection function of our sample and, consequently, for investigating the probability distributions of stellar parameters (e.g., for investigating the underlying age distribution in our companion paper, Paper II; Tsujimoto et al. 2026). By comparing our stellar parameters, ages, and Mini with values from high-precision literature samples (Sect. 5.2), we found good agreement with many previous differential solar twin studies (Fig. E.1), but there are discrepancies relative to some large data-driven catalogs (Fig. E.2).
To showcase the scientific potential of our catalog, we investigated age-[X/Fe] relations (Sect. 6). For this purpose, we combined GSP-Spec, APOGEE DR17, and GALAH DR4 abundances to compare the resulting age-[X/Fe] trends with those from high-precision studies by Bedell et al. (2018) and Spina et al. (2018) (Figs. 6 and E.3). We discussed the age-[X/Fe] relations in two regards: slopes and s-enhanced stars. Focusing first on the slopes of the age-[X/Fe] relations (Sect. 6.1), we recovered the classical positive age-[Al/Fe] and negative age-[Y/Fe] trends, supporting the reliability of our age determinations. For most elements, the age-[X/Fe] slopes agree well with those derived from a small high-precision sample by Bedell et al. (2018), thus supporting these relations in a more statistical regime. Nevertheless, we found discrepancies for S and Ni measured by Gaia DR3 GSP-Spec, for which selection effects or systematic errors may have altered the GSP-Spec abundances. We also pointed out that age-[X/Fe] relations are not necessarily linear and that the age distribution of the solar twin sample can modify the measured slopes, potentially even changing their signs. In addition, we identified a possible sudden drop in [Ni/Fe] (and in some other elements) around 2 Gyr ago. We searched for s-process-enhanced solar twins using GALAH DR4 [Y/Fe] measurements (Sect. 6.2), but we found no clear examples (at most one candidate) among the 80 solar twins with available [Y/Fe]. We will also investigate the α-enhanced solar twins in our companion paper (Paper III; Taniguchi et al., in prep.).
Beyond the analyses presented in this study, our large, homogeneous, and well-characterized catalog provides a complementary resource to both high-precision small samples and large data-driven catalogs. It enables further investigations that benefit from model-driven stellar parameters with a quantified selection function. In our companion paper (Paper II; Tsujimoto et al. 2026), we will use our catalog to examine the age distribution of solar twins and the implied efficiency of radial migration of the Sun.
Data availability
Our final catalog of 6594 solar twins is available at the CDS via https://cdsarc.cds.unistra.fr/viz-bin/cat/J/A+A/707/A260 (see Table E.2 for a description of the catalog columns).
Table E.1. Final solar twin catalog (available at the CDS).
Fig. E.4. Comparison of stellar parameters with literature. Only available at Zenodo (https://doi.org/10.5281/zenodo.18408912).
Acknowledgements
We acknowledges useful comments from the anonymous referee. This work has been supported by the Tokyo Center For Excellence Project, Tokyo Metropolitan University. DT acknowledges financial support from JSPS Research Fellowship for Young Scientists and accompanying Grants-in-Aid for JSPS Fellows (23KJ2149). PdL and ARB acknowledge partial funding from the European Union’s Horizon 2020 research and innovation program under SPACE-H2020 grant agreement number 101004214 (EXPLORE project). TT acknowledges the support by JSPS KAKENHI Grant No. 23H00132. This work presents results from the European Space Agency (ESA) space mission Gaia. Gaia data are being processed by the Gaia Data Processing and Analysis Consortium (DPAC). Funding for the DPAC is provided by national institutions, in particular the institutions participating in the Gaia MultiLateral Agreement (MLA). The Gaia mission website is https://www.cosmos.esa.int/gaia. The Gaia archive website is https://archives.esac.esa.int/gaia. This publication makes use of data products from the Two Micron All Sky Survey, which is a joint project of the University of Massachusetts and the Infrared Processing and Analysis Center/California Institute of Technology, funded by the National Aeronautics and Space Administration and the National Science Foundation.
References
- Abdurro’uf, Accetta, K., Aerts, C., et al. 2022, ApJS, 259, 35 [NASA ADS] [CrossRef] [Google Scholar]
- Adibekyan, V. Z., Sousa, S. G., Santos, N. C., et al. 2012, A&A, 545, A32 [NASA ADS] [CrossRef] [EDP Sciences] [Google Scholar]
- Adibekyan, V., Delgado-Mena, E., Figueira, P., et al. 2016, A&A, 592, A87 [NASA ADS] [CrossRef] [EDP Sciences] [Google Scholar]
- Adibekyan, V., de Laverny, P., Recio-Blanco, A., et al. 2018, A&A, 619, A130 [NASA ADS] [CrossRef] [EDP Sciences] [Google Scholar]
- Amelin, Y., Krot, A. N., Hutcheon, I. D., & Ulyanov, A. A. 2002, Science, 297, 1678 [NASA ADS] [CrossRef] [Google Scholar]
- An, Q., Brandt, T. D., Brandt, G. M., & Venner, A. 2025, ApJS, 280, 61 [Google Scholar]
- Annem, B., & Khoperskov, S. 2024, MNRAS, 527, 2426 [Google Scholar]
- Bailer-Jones, C. A. L., Rybizki, J., Fouesneau, M., Demleitner, M., & Andrae, R. 2021, AJ, 161, 147 [Google Scholar]
- Barbillon, M., Recio-Blanco, A., de Laverny, P., & Palicio, P. A. 2025, arXiv e-prints [arXiv:2511.12156] [Google Scholar]
- Baumann, P., Ramírez, I., Meléndez, J., Asplund, M., & Lind, K. 2010, A&A, 519, A87 [NASA ADS] [CrossRef] [EDP Sciences] [Google Scholar]
- Beck, P. G., do Nascimento, Jr., J. D., Duarte, T., et al. 2017, A&A, 602, A63 [NASA ADS] [CrossRef] [EDP Sciences] [Google Scholar]
- Bedell, M., Meléndez, J., Bean, J. L., et al. 2014, ApJ, 795, 23 [Google Scholar]
- Bedell, M., Bean, J. L., Meléndez, J., et al. 2018, ApJ, 865, 68 [Google Scholar]
- Bellardini, M. A., Wetzel, A., Loebman, S. R., et al. 2021, MNRAS, 505, 4586 [CrossRef] [Google Scholar]
- Berger, T. A., Huber, D., van Saders, J. L., et al. 2020, AJ, 159, 280 [Google Scholar]
- Bernstein, R., Shectman, S. A., Gunnels, S. M., Mochnacki, S., & Athey, A. E. 2003, SPIE Conf. Ser., 4841, 1694 [NASA ADS] [Google Scholar]
- Bertelli Motta, C., Pasquali, A., Richer, J., et al. 2018, MNRAS, 478, 425 [NASA ADS] [CrossRef] [Google Scholar]
- Bhattarai, B., Loebman, S. R., Ness, M. K., et al. 2024, ApJ, 977, 70 [Google Scholar]
- Bohlin, R. C., Hubeny, I., & Rauch, T. 2020, AJ, 160, 21 [Google Scholar]
- Bonanno, A., Schlattl, H., & Paterno, L. 2002, A&A, 390, 1115 [NASA ADS] [CrossRef] [EDP Sciences] [Google Scholar]
- Bouvier, A., & Wadhwa, M. 2010, Nat. Geosci., 3, 637 [NASA ADS] [CrossRef] [Google Scholar]
- Brandt, T. D. 2018, ApJS, 239, 31 [Google Scholar]
- Brandt, T. D. 2021, ApJS, 254, 42 [NASA ADS] [CrossRef] [Google Scholar]
- Bressan, A., Marigo, P., Girardi, L., et al. 2012, MNRAS, 427, 127 [NASA ADS] [CrossRef] [Google Scholar]
- Brewer, J. M., & Fischer, D. A. 2018, ApJS, 237, 38 [NASA ADS] [CrossRef] [Google Scholar]
- Brewer, J. M., Fischer, D. A., Valenti, J. A., & Piskunov, N. 2016, ApJS, 225, 32 [Google Scholar]
- Buder, S., Asplund, M., Duong, L., et al. 2018, MNRAS, 478, 4513 [Google Scholar]
- Buder, S., Sharma, S., Kos, J., et al. 2021, MNRAS, 506, 150 [NASA ADS] [CrossRef] [Google Scholar]
- Buder, S., Kos, J., Wang, X. E., et al. 2025, PASA, 42, e051 [Google Scholar]
- Butler, R. P., Vogt, S. S., Laughlin, G., et al. 2017, AJ, 153, 208 [Google Scholar]
- Caffau, E., Ludwig, H. G., Steffen, M., Freytag, B., & Bonifacio, P. 2011, Sol. Phys., 268, 255 [Google Scholar]
- Carlos, M., Amarsi, A. M., Nissen, P. E., & Canocchi, G. 2025, A&A, 700, A127 [NASA ADS] [CrossRef] [EDP Sciences] [Google Scholar]
- Carvalho-Silva, G., Meléndez, J., Rathsam, A., et al. 2025, ApJ, 983, L31 [Google Scholar]
- Casagrande, L., & VandenBerg, D. A. 2018, MNRAS, 479, L102 [NASA ADS] [CrossRef] [Google Scholar]
- Casagrande, L., Lin, J., Rains, A. D., et al. 2021, MNRAS, 507, 2684 [NASA ADS] [CrossRef] [Google Scholar]
- Casali, G., Spina, L., Magrini, L., et al. 2020, A&A, 639, A127 [NASA ADS] [CrossRef] [EDP Sciences] [Google Scholar]
- Casamiquela, L., Castro-Ginard, A., Anders, F., & Soubiran, C. 2021, A&A, 654, A151 [NASA ADS] [CrossRef] [EDP Sciences] [Google Scholar]
- Cayrel de Strobel, G. 1996, A&A Rev., 7, 243 [Google Scholar]
- Cayrel de Strobel, G., Knowles, N., Hernandez, G., & Bentolila, C. 1981, A&A, 94, 1 [NASA ADS] [Google Scholar]
- Chen, Y., Bressan, A., Girardi, L., et al. 2015, MNRAS, 452, 1068 [Google Scholar]
- Chen, Y., Girardi, L., Fu, X., et al. 2019, A&A, 632, A105 [EDP Sciences] [Google Scholar]
- Christensen-Dalsgaard, J., Dappen, W., Ajukov, S. V., et al. 1996, Science, 272, 1286 [Google Scholar]
- Christiansen, J. L., McElroy, D. L., Harbut, M., et al. 2025, PSJ, 6, 186 [Google Scholar]
- Cohen, M., Wheaton, W. A., & Megeath, S. T. 2003, AJ, 126, 1090 [Google Scholar]
- Contursi, G., de Laverny, P., Recio-Blanco, A., et al. 2023, A&A, 670, A106 [NASA ADS] [CrossRef] [EDP Sciences] [Google Scholar]
- Contursi, G., de Laverny, P., Recio-Blanco, A., Palicio, P. A., & Abia, C. 2024, A&A, 683, A138 [NASA ADS] [CrossRef] [EDP Sciences] [Google Scholar]
- Creevey, O. L., Sordo, R., Pailler, F., et al. 2023, A&A, 674, A26 [NASA ADS] [CrossRef] [EDP Sciences] [Google Scholar]
- Cropper, M., Katz, D., Sartoretti, P., et al. 2018, A&A, 616, A5 [NASA ADS] [CrossRef] [EDP Sciences] [Google Scholar]
- Cutri, R. M., Skrutskie, M. F., van Dyk, S., et al. 2003, 2MASS All Sky Catalog of point sources [Google Scholar]
- da Silva, R., Porto de Mello, G. F., Milone, A. C., et al. 2012, A&A, 542, A84 [NASA ADS] [CrossRef] [EDP Sciences] [Google Scholar]
- da Silva, R., D’Orazi, V., Palla, M., et al. 2023, A&A, 678, A195 [NASA ADS] [CrossRef] [EDP Sciences] [Google Scholar]
- Datson, J., Flynn, C., & Portinari, L. 2015, A&A, 574, A124 [NASA ADS] [CrossRef] [EDP Sciences] [Google Scholar]
- de Laverny, P., Ligi, R., Crida, A., Recio-Blanco, A., & Palicio, P. A. 2025, A&A, 699, A100 [Google Scholar]
- De Silva, G. M., Freeman, K. C., Bland-Hawthorn, J., et al. 2015, MNRAS, 449, 2604 [NASA ADS] [CrossRef] [Google Scholar]
- Delgado Mena, E., Tsantaki, M., Adibekyan, V. Z., et al. 2017, A&A, 606, A94 [NASA ADS] [CrossRef] [EDP Sciences] [Google Scholar]
- Delgado Mena, E., Moya, A., Adibekyan, V., et al. 2019, A&A, 624, A78 [NASA ADS] [CrossRef] [EDP Sciences] [Google Scholar]
- dos Santos, L. A., Meléndez, J., Bedell, M., et al. 2017, MNRAS, 472, 3425 [NASA ADS] [CrossRef] [Google Scholar]
- Dotter, A., Conroy, C., Cargile, P., & Asplund, M. 2017, ApJ, 840, 99 [Google Scholar]
- Duffau, S., Caffau, E., Sbordone, L., et al. 2017, A&A, 604, A128 [NASA ADS] [CrossRef] [EDP Sciences] [Google Scholar]
- Dziembowski, W. A., Fiorentini, G., Ricci, B., & Sienkiewicz, R. 1999, A&A, 343, 990 [NASA ADS] [Google Scholar]
- Fouesneau, M., Andrae, R., Sordo, R., & Dharmawardena, T. 2022, dustapprox, https://github.com/mfouesneau/dustapprox, version 0.1 [Google Scholar]
- Fouesneau, M., Frémat, Y., Andrae, R., et al. 2023, A&A, 674, A28 [NASA ADS] [CrossRef] [EDP Sciences] [Google Scholar]
- Freeman, K., & Bland-Hawthorn, J. 2002, ARA&A, 40, 487 [Google Scholar]
- Gaia Collaboration (Prusti, T., et al.) 2016, A&A, 595, A1 [NASA ADS] [CrossRef] [EDP Sciences] [Google Scholar]
- Gaia Collaboration (Creevey, O. L., et al.) 2023a, A&A, 674, A39 [CrossRef] [EDP Sciences] [Google Scholar]
- Gaia Collaboration (Recio-Blanco, A., et al.) 2023b, A&A, 674, A38 [CrossRef] [EDP Sciences] [Google Scholar]
- Gaia Collaboration (Vallenari, A., et al.) 2023c, A&A, 674, A1 [NASA ADS] [CrossRef] [EDP Sciences] [Google Scholar]
- Ghezzi, L., Cunha, K., Smith, V. V., et al. 2010, ApJ, 720, 1290 [NASA ADS] [CrossRef] [Google Scholar]
- Gonzalez, G. 2014, MNRAS, 441, 1201 [CrossRef] [Google Scholar]
- Gonzalez, G. 2015, MNRAS, 446, 1020 [NASA ADS] [CrossRef] [Google Scholar]
- Gonzalez, G., Laws, C., Tyagi, S., & Reddy, B. E. 2001, AJ, 121, 432 [CrossRef] [Google Scholar]
- Gonzalez, G., Carlson, M. K., & Tobin, R. W. 2010, MNRAS, 403, 1368 [NASA ADS] [CrossRef] [Google Scholar]
- González Hernández, J. I., Israelian, G., Santos, N. C., et al. 2010, ApJ, 720, 1592 [CrossRef] [Google Scholar]
- GRAVITY Collaboration (Abuter, R., et al.) 2020, A&A, 636, L5 [NASA ADS] [CrossRef] [EDP Sciences] [Google Scholar]
- Gray, D. F. 2005, The Observation and Analysis of Stellar Photospheres (Cambridge: Cambridge University Press) [Google Scholar]
- Green, G. M. 2018, J. Open Source Softw., 3, 695 [Google Scholar]
- Green, G. M., Schlafly, E., Zucker, C., Speagle, J. S., & Finkbeiner, D. 2019, ApJ, 887, 93 [NASA ADS] [CrossRef] [Google Scholar]
- Grevesse, N., & Sauval, A. J. 1998, Space Sci. Rev., 85, 161 [Google Scholar]
- Hardorp, J. 1978, A&A, 63, 383 [NASA ADS] [Google Scholar]
- Hinkel, N. R., Timmes, F. X., Young, P. A., Pagano, M. D., & Turnbull, M. C. 2014, AJ, 148, 54 [NASA ADS] [CrossRef] [Google Scholar]
- Holmberg, J., Flynn, C., & Portinari, L. 2006, MNRAS, 367, 449 [NASA ADS] [CrossRef] [Google Scholar]
- Houdek, G., & Gough, D. O. 2011, MNRAS, 418, 1217 [NASA ADS] [CrossRef] [Google Scholar]
- Huber, D., Zinn, J., Bojsen-Hansen, M., et al. 2017, ApJ, 844, 102 [Google Scholar]
- Israelian, G., Santos, N. C., Mayor, M., & Rebolo, R. 2004, A&A, 414, 601 [NASA ADS] [CrossRef] [EDP Sciences] [Google Scholar]
- Israelian, G., Delgado Mena, E., Santos, N. C., et al. 2009, Nature, 462, 189 [NASA ADS] [CrossRef] [Google Scholar]
- Jofré, P., Heiter, U., Worley, C. C., et al. 2017, A&A, 601, A38 [Google Scholar]
- Johnson, J. W., Weinberg, D. H., Vincenzo, F., et al. 2021, MNRAS, 508, 4484 [NASA ADS] [CrossRef] [Google Scholar]
- Jørgensen, B. R., & Lindegren, L. 2005, A&A, 436, 127 [Google Scholar]
- Katz, D., Sartoretti, P., Guerrier, A., et al. 2023, A&A, 674, A5 [NASA ADS] [CrossRef] [EDP Sciences] [Google Scholar]
- King, J. R., Boesgaard, A. M., & Schuler, S. C. 2005, AJ, 130, 2318 [Google Scholar]
- Kippenhahn, R., Weigert, A., & Weiss, A. 2013, Stellar Structure and Evolution (Heidelberg: Springer Berlin) [Google Scholar]
- Kordopatis, G., Schultheis, M., McMillan, P. J., et al. 2023, A&A, 669, A104 [NASA ADS] [CrossRef] [EDP Sciences] [Google Scholar]
- Kroupa, P. 2001, MNRAS, 322, 231 [NASA ADS] [CrossRef] [Google Scholar]
- Laws, C., Gonzalez, G., Walker, K. M., et al. 2003, AJ, 125, 2664 [Google Scholar]
- Lehmann, C., Murphy, M. T., Liu, F., Flynn, C., & Berke, D. A. 2022, MNRAS, 512, 11 [Google Scholar]
- Lehmann, C., Murphy, M. T., Liu, F., et al. 2023, MNRAS, 521, 148 [Google Scholar]
- Lehmann, C., Murphy, M. T., Liu, F., & Flynn, C. 2025, MNRAS, 536, 498 [Google Scholar]
- Leike, R. H., Glatzle, M., & Enßlin, T. A. 2020, A&A, 639, A138 [NASA ADS] [CrossRef] [EDP Sciences] [Google Scholar]
- Liu, F., Asplund, M., Yong, D., et al. 2019, A&A, 627, A117 [NASA ADS] [CrossRef] [EDP Sciences] [Google Scholar]
- Liu, F., Yong, D., Asplund, M., et al. 2020, MNRAS, 495, 3961 [NASA ADS] [CrossRef] [Google Scholar]
- López-Valdivia, R., Bertone, E., Chávez, M., et al. 2014, MNRAS, 444, 2251 [Google Scholar]
- López-Valdivia, R., Bertone, E., & Chávez, M. 2017, MNRAS, 467, 2412 [Google Scholar]
- Lorenzo-Oliveira, D., Freitas, F. C., Meléndez, J., et al. 2018, A&A, 619, A73 [NASA ADS] [CrossRef] [EDP Sciences] [Google Scholar]
- Luck, R. E. 2018, AJ, 156, 171 [Google Scholar]
- Magrini, L., Viscasillas Vázquez, C., Spina, L., et al. 2023, A&A, 669, A119 [NASA ADS] [CrossRef] [EDP Sciences] [Google Scholar]
- Mahdi, D., Soubiran, C., Blanco-Cuaresma, S., & Chemin, L. 2016, A&A, 587, A131 [NASA ADS] [CrossRef] [EDP Sciences] [Google Scholar]
- Majewski, S. R., Schiavon, R. P., Frinchaboy, P. M., et al. 2017, AJ, 154, 94 [NASA ADS] [CrossRef] [Google Scholar]
- Martos, G., Meléndez, J., Rathsam, A., & Carvalho Silva, G. 2023, MNRAS, 522, 3217 [NASA ADS] [CrossRef] [Google Scholar]
- Martos, G., Meléndez, J., Spina, L., & Lucatello, S. 2025, A&A, 699, A46 [NASA ADS] [CrossRef] [EDP Sciences] [Google Scholar]
- Mayor, M., Pepe, F., Queloz, D., et al. 2003, Messenger, 114, 20 [Google Scholar]
- Meléndez, J., & Ramírez, I. 2007, ApJ, 669, L89 [Google Scholar]
- Meléndez, J., Dodds-Eden, K., & Robles, J. A. 2006, ApJ, 641, L133 [CrossRef] [Google Scholar]
- Meléndez, J., Asplund, M., Gustafsson, B., & Yong, D. 2009, ApJ, 704, L66 [Google Scholar]
- Minchev, I., Chiappini, C., & Martig, M. 2013, A&A, 558, A9 [CrossRef] [EDP Sciences] [Google Scholar]
- Mor, R., Robin, A. C., Figueras, F., Roca-Fàbrega, S., & Luri, X. 2019, A&A, 624, L1 [NASA ADS] [CrossRef] [EDP Sciences] [Google Scholar]
- Ness, M., Hogg, D. W., Rix, H. W., Ho, A. Y. Q., & Zasowski, G. 2015, ApJ, 808, 16 [NASA ADS] [CrossRef] [Google Scholar]
- Ness, M. K., Johnston, K. V., Blancato, K., et al. 2019, ApJ, 883, 177 [CrossRef] [Google Scholar]
- Ness, M. K., Wheeler, A. J., McKinnon, K., et al. 2022, ApJ, 926, 144 [NASA ADS] [CrossRef] [Google Scholar]
- Neves, V., Santos, N. C., Sousa, S. G., Correia, A. C. M., & Israelian, G. 2009, A&A, 497, 563 [NASA ADS] [CrossRef] [EDP Sciences] [Google Scholar]
- Nibauer, J., Baxter, E. J., Jain, B., et al. 2021, ApJ, 907, 116 [Google Scholar]
- Nissen, P. E. 2015, A&A, 579, A52 [NASA ADS] [CrossRef] [EDP Sciences] [Google Scholar]
- Nissen, P. E. 2016, A&A, 593, A65 [NASA ADS] [CrossRef] [EDP Sciences] [Google Scholar]
- Nissen, P. E., & Gustafsson, B. 2018, A&A Rev., 26, 6 [Google Scholar]
- Nissen, P. E., Christensen-Dalsgaard, J., Mosumgaard, J. R., et al. 2020, A&A, 640, A81 [NASA ADS] [CrossRef] [EDP Sciences] [Google Scholar]
- Palicio, P. A., Recio-Blanco, A., Poggio, E., et al. 2023, A&A, 670, L7 [NASA ADS] [CrossRef] [EDP Sciences] [Google Scholar]
- Palla, M., Magrini, L., Spitoni, E., et al. 2024, A&A, 690, A334 [NASA ADS] [CrossRef] [EDP Sciences] [Google Scholar]
- Pasquini, L., Biazzo, K., Bonifacio, P., Randich, S., & Bedin, L. R. 2008, A&A, 489, 677 [NASA ADS] [CrossRef] [EDP Sciences] [Google Scholar]
- Patterson, C. 1956, Geochim. Cosmochim. Acta, 10, 230 [NASA ADS] [CrossRef] [Google Scholar]
- Perdigon, J., de Laverny, P., Recio-Blanco, A., et al. 2021, A&A, 647, A162 [NASA ADS] [CrossRef] [EDP Sciences] [Google Scholar]
- Plotnikova, A., Spina, L., Ratcliffe, B., Casali, G., & Carraro, G. 2024, A&A, 691, A298 [NASA ADS] [CrossRef] [EDP Sciences] [Google Scholar]
- Porto de Mello, G. F., & da Silva, L. 1997, ApJ, 482, L89 [CrossRef] [Google Scholar]
- Porto de Mello, G. F., da Silva, R., da Silva, L., & de Nader, R. V. 2014, A&A, 563, A52 [NASA ADS] [CrossRef] [EDP Sciences] [Google Scholar]
- Prsa, A., Harmanec, P., Torres, G., et al. 2016, AJ, 152, 41 [NASA ADS] [CrossRef] [Google Scholar]
- Ramírez, I., Meléndez, J., & Asplund, M. 2009, A&A, 508, L17 [NASA ADS] [CrossRef] [EDP Sciences] [Google Scholar]
- Ramírez, I., Meléndez, J., Bean, J., et al. 2014, A&A, 572, A48 [Google Scholar]
- Rampalli, R., Ness, M. K., Edwards, G. H., Newton, E. R., & Bedell, M. 2024, ApJ, 965, 176 [Google Scholar]
- Rathsam, A., Meléndez, J., & Carvalho Silva, G. 2023, MNRAS, 525, 4642 [CrossRef] [Google Scholar]
- Recio-Blanco, A., de Laverny, P., Allende Prieto, C., et al. 2016, A&A, 585, A93 [NASA ADS] [CrossRef] [EDP Sciences] [Google Scholar]
- Recio-Blanco, A., de Laverny, P., Palicio, P. A., et al. 2023, A&A, 674, A29 [NASA ADS] [CrossRef] [EDP Sciences] [Google Scholar]
- Recio-Blanco, A., de Laverny, P., Palicio, P. A., et al. 2024, A&A, 692, A235 [NASA ADS] [CrossRef] [EDP Sciences] [Google Scholar]
- Reddy, A. B. S., & Lambert, D. L. 2017, ApJ, 845, 151 [Google Scholar]
- Riello, M., De Angeli, F., Evans, D. W., et al. 2021, A&A, 649, A3 [NASA ADS] [CrossRef] [EDP Sciences] [Google Scholar]
- Ruiz-Lara, T., Gallart, C., Bernard, E. J., & Cassisi, S. 2020, Nat. Astron., 4, 965 [NASA ADS] [CrossRef] [Google Scholar]
- Rybizki, J., Green, G. M., Rix, H.-W., et al. 2022, MNRAS, 510, 2597 [NASA ADS] [CrossRef] [Google Scholar]
- Sahlholdt, C. 2020, https://doi.org/10.5281/zenodo.3941733 [Google Scholar]
- Salaris, M., Chieffi, A., & Straniero, O. 1993, ApJ, 414, 580 [NASA ADS] [CrossRef] [Google Scholar]
- Schirbel, L., Meléndez, J., Karakas, A. I., et al. 2015, A&A, 584, A116 [NASA ADS] [CrossRef] [EDP Sciences] [Google Scholar]
- Schönrich, R., Binney, J., & Dehnen, W. 2010, MNRAS, 403, 1829 [NASA ADS] [CrossRef] [Google Scholar]
- Sharma, S., Stello, D., Buder, S., et al. 2018, MNRAS, 473, 2004 [NASA ADS] [CrossRef] [Google Scholar]
- Sharma, S., Hayden, M. R., Bland-Hawthorn, J., et al. 2022, MNRAS, 510, 734 [Google Scholar]
- Shejeelammal, J., Meléndez, J., Rathsam, A., & Martos, G. 2024, A&A, 690, A107 [NASA ADS] [CrossRef] [EDP Sciences] [Google Scholar]
- Skrutskie, M. F., Cutri, R. M., Stiening, R., et al. 2006, AJ, 131, 1163 [NASA ADS] [CrossRef] [Google Scholar]
- Soubiran, C., & TrPrsa2016d, A. 2004, A&A, 418, 1089 [NASA ADS] [CrossRef] [EDP Sciences] [Google Scholar]
- Sousa, S. G., Santos, N. C., Mayor, M., et al. 2008, A&A, 487, 373 [NASA ADS] [CrossRef] [EDP Sciences] [Google Scholar]
- Sousa, S. G., Santos, N. C., Israelian, G., Mayor, M., & Udry, S. 2011, A&A, 533, A141 [NASA ADS] [CrossRef] [EDP Sciences] [Google Scholar]
- Souto, D., Allende Prieto, C., Cunha, K., et al. 2019, ApJ, 874, 97 [NASA ADS] [CrossRef] [Google Scholar]
- Spina, L., Meléndez, J., Karakas, A. I., et al. 2016a, A&A, 593, A125 [NASA ADS] [CrossRef] [EDP Sciences] [Google Scholar]
- Spina, L., Meléndez, J., & Ramírez, I. 2016b, A&A, 585, A152 [NASA ADS] [CrossRef] [EDP Sciences] [Google Scholar]
- Spina, L., Meléndez, J., Karakas, A. I., et al. 2018, MNRAS, 474, 2580 [NASA ADS] [Google Scholar]
- Spina, L., Sharma, P., Meléndez, J., et al. 2021, Nat. Astron., 5, 1163 [NASA ADS] [CrossRef] [Google Scholar]
- Spitoni, E., Recio-Blanco, A., de Laverny, P., et al. 2023, A&A, 670, A109 [NASA ADS] [CrossRef] [EDP Sciences] [Google Scholar]
- Sun, Q., Ji, C., Wang, S. X., et al. 2025a, A&A, 701, A107 [NASA ADS] [CrossRef] [EDP Sciences] [Google Scholar]
- Sun, Q., Wang, S. X., Gan, T., et al. 2025b, ApJ, 980, 179 [Google Scholar]
- Sun, T., Bi, S., Chen, X., et al. 2025c, Nat. Commun., 16, 1581 [Google Scholar]
- Takeda, Y., & Tajitsu, A. 2009, PASJ, 61, 471 [NASA ADS] [Google Scholar]
- Takeda, Y., Kawanomoto, S., Honda, S., Ando, H., & Sakurai, T. 2007, A&A, 468, 663 [NASA ADS] [CrossRef] [EDP Sciences] [Google Scholar]
- Tal-Or, L., Trifonov, T., Zucker, S., Mazeh, T., & Zechmeister, M. 2019, MNRAS, 484, L8 [Google Scholar]
- Taniguchi, D., Matsunaga, N., Kobayashi, N., et al. 2025, A&A, 693, A163 [NASA ADS] [CrossRef] [EDP Sciences] [Google Scholar]
- Tsantaki, M., Sousa, S. G., Adibekyan, V. Z., et al. 2013, A&A, 555, A150 [NASA ADS] [CrossRef] [EDP Sciences] [Google Scholar]
- Tsujimoto, T. 2021, ApJ, 920, L32 [Google Scholar]
- Tsujimoto, T., Nomoto, K., Yoshii, Y., et al. 1995, MNRAS, 277, 945 [Google Scholar]
- Tsujimoto, T., Taniguchi, D., Recio-Blanco, A., Palicio, P. A., & de Laverny, P. 2026, A&A, 707, L11 [NASA ADS] [CrossRef] [EDP Sciences] [Google Scholar]
- Tucci Maia, M., Ramírez, I., Meléndez, J., et al. 2016, A&A, 590, A32 [NASA ADS] [CrossRef] [EDP Sciences] [Google Scholar]
- Turcotte, S., & Wimmer-Schweingruber, R. F. 2002, J. Geophys. Res. (Space Phys.), 107, 1442 [Google Scholar]
- Walsen, K., Jofré, P., Buder, S., et al. 2024, MNRAS, 529, 2946 [NASA ADS] [CrossRef] [Google Scholar]
- Willmer, C. N. A. 2018, ApJS, 236, 47 [Google Scholar]
- Yana Galarza, J., Meléndez, J., Lorenzo-Oliveira, D., et al. 2019, MNRAS, 490, L86 [Google Scholar]
- Yana Galarza, J., López-Valdivia, R., Lorenzo-Oliveira, D., et al. 2021, MNRAS, 504, 1873 [NASA ADS] [CrossRef] [Google Scholar]
- Yong, D., Grundahl, F., & Norris, J. E. 2015, MNRAS, 446, 3319 [NASA ADS] [CrossRef] [Google Scholar]
- Zwitter, T., Matijevic, G., Breddels, M. A., et al. 2010, A&A, 522, A54 [NASA ADS] [CrossRef] [EDP Sciences] [Google Scholar]
- Zwitter, T., Kos, J., Chiavassa, A., et al. 2018, MNRAS, 481, 645 [NASA ADS] [CrossRef] [Google Scholar]
The level of similarity required and whether other properties (e.g., age, rotational velocity, or Li abundance) are included depends on the specific purpose of a given solar twin study.
Within GSP-Spec, [M/H] is a proxy for [Fe/H] abundance (Recio-Blanco et al. 2023, 2024).
We note that, throughout this paper, we shifted the zero-points in literature Teff and log g values to our adopted scale, Teff,⊙ = 5777 K and log gα = 4.44, if the reference solar values are explicitly mentioned.
During the calibration process described in Appendix A, the errors in log g shrank. The adopted broken-line relation implies that the largest shrinkage occurs in stars with higher log g (original log g ≳ 4.5, or equivalently, calibrated log g ≳ 4.48), where they were reduced to a2 = 0.133 times their original error values.
The zero-point in the initial-metallicity scale is assumed to be (Z/X)⊙ = 0.0207 as suggested by Bressan et al. (2012), who compiled literature solar abundances from Grevesse & Sauval (1998), Caffau et al. (2011), and references therein.
We used Ys = 0.24787 and Zs = 0.01597 (Bressan et al. 2012), and hence (Z/X)s = 0.02169 to set the zero-point in the current metallicity [M/H]curr, which is different from the zero-point in the initial metallicity [M/H]ini, (Z/X)⊙ = 0.0207. The use of (Z/X)s as the zero-point is intended to ensure that the solar Teff and log g can be reproduced with the solar age, solar [M/H]curr model.
For the observed [M/H]curr and its error, we corrected for the effect of [α/Fe] on isochrones using the equation in Salaris et al. (1993).
In our catalog of solar twins, similar to the log g error, the errors in [M/H] and [α/Fe] are quantized in 0.005 increments. Thus, there are 4 and 12 stars with the [M/H] and [α/Fe] errors of 0.000 dex, respectively. Since we used the [M/H] value with the effect of [α/Fe] on isochrones corrected, the error in the adopted (or corrected) “[M/H]” values are not in increments of 0.005.
Given the oversampling of Gaia RVS, this translates into the median S/N per spectral resolution element of ~140.
Because CN molecular lines are present in the RVS wavelength range (Recio-Blanco et al. 2024), and their strengths depend on the C, N, and O abundances through temperature-dependent molecular equilibrium (see, e.g., Yong et al. 2015; Taniguchi et al. 2025), the RVS spectra in principle contain information on the C and O abundances. Nevertheless, judging from Fig. A1 in Rampalli et al. (2024), their derived [C/H] and [O/H] abundances do not appear to rely strongly on CN lines.
Comparisons to all the literature listed in Table 2 are available in Fig. E.4 at Zenodo (https://doi.org/10.5281/zenodo.18408912).
Ideally, the stellar parameters reported by Walsen et al. (2024) and Lehmann et al. (2025) would be directly compared with those from high-precision solar twin studies (e.g., Tucci Maia et al. 2016; Nissen et al. 2020; Shejeelammal et al. 2024). In practice, however, such a comparison is not feasible because the distance ranges of the solar twin samples differ substantially between these studies: the samples in Walsen et al. (2024) and Lehmann et al. (2025) are dominated by more distant stars, whereas high-precision solar twin studies focus on nearby targets to achieve very high S/N. As a result, there are very few (if any) solar twins in common between the two sets of studies, preventing a meaningful star-by-star comparison.
Because the ages of Rampalli et al. (2024) were determined using Teff, [M/H], and log g, they correlate more strongly with our logg-based ages (r = 0.52) than with our adopted MKs -based ages (r = 0.36), although the correlation remains modest in both cases.
For all the Gaia DR3 GSP-Spec, APOGEE DR17, and GALAH DR4 abundances, we added zero-point offsets in [X/Fe] so that, for elements analyzed by Bedell et al. (2018), our solar twins in the 0.5-8 Gyr range show no systematic offset from the linear age-[X/Fe] relations in that study, which were calibrated over a similar age interval. The added offsets are listed in Table E.3.
[Fe/H] of HIP 10725 is −0.173 dex, which is much lower than our solar twin criterion (±0.1 dex around the solar value).
[Fe/H] of HD 138004 is −0.109 ± 0.011 dex, slightly outside our solar twin criterion (±0.1 dex around the solar value), but consistent with it within the uncertainty. Thus, we include this star in our discussion.
We note that, unlike GALAH DR2, where The Cannon was used, Buder et al. (2021) chose not to use The Cannon (or any other data-driven approaches) for GALAH DR3 because such methods can suffer from signal aliasing and learn unphysical correlations between input data and output labels.
Appendix A Zero-point corrections of GSP-Spec stellar parameters
The accuracy of the GSP-Spec stellar parameters is generally sufficient for many types of analyses. Even though, for solar twin studies, which require very high zero-point accuracy relative to the solar values, the GSP-Spec zero-point accuracy is insufficient. In fact, comparisons with differentially derived solar twin stellar parameters have revealed systematic zero-point biases (Fouesneau et al. 2023; Gaia Collaboration 2023a). To quantify such biases in our dataset, we compared our GSP-Spec stellar parameters with those determined by Tucci Maia et al. (2016), Nissen et al. (2020), and Shejeelammal et al. (2024). These three studies are extensions and reanalyses of former studies by Ramírez et al. (2014), Nissen (2015, 2016), and Spina et al. (2018); Martos et al. (2023); Rathsam et al. (2023), respectively. We arbitrarily selected these particular studies, among several that also meet the criteria below, for three reasons. First, they employed line-by-line differential analyses relative to the solar spectrum, ensuring reliable zero points. Second, they derived atmospheric parameters with high precision using high-quality spectra, i.e., S/N of ≳500 using the MIKE (Bernstein et al. 2003) or HARPS (Mayor et al. 2003) high-resolution spectrographs. Third, their samples contain a sufficiently large overlap of several tens of stars with ours.
Figure A.1 compares our GSP-Spec stellar parameters with those from these three studies. Only stars meeting all of the following conditions are included:
Their literature parameters (not GSP-Spec values) satisfy our solar twin criteria, i.e., Teff, log g, and [M/H] within ±200 K, ±0.2, and ±0.1 dex of the solar values.
They satisfy the quality assessments described in Sect. 2.1.
They have S/N (rv_expected_sig_to_noise) >80 and reduced χ2 (logchisq_gspspec) < - 3.7, ensuring best precision in GSP-Spec.
We note that, the literature targets lie near the bright end of our GSP-Spec sample, and thus the third criterion on the precision of the GSP-Spec parameters excludes only one star.
The three comparisons show excellent agreement in Teff, given the scatter. Similar levels of agreement are found in comparisons with other studies not shown in the figure. In contrast, clear residual biases remain in GSP-Spec log g and [M/H], despite our prior calibration of these parameters using the relations presented by Recio-Blanco et al. (2024), which were designed to match the log g and [M/H] scales to APOGEE DR17 (Abdurro’uf et al. 2022) and GALAH DR3 (Buder et al. 2021) catalogs.
In order to ensure that the GSP-Spec stellar parameters are strictly differential with respect to the solar values, we further calibrated GSP-Spec stellar parameters. For Teff and [M/H], we calculated the mean of the difference between GSP-Spec and literature parameters, and added these offsets, 1 K in Teff and 0.062 dex in [M/H], to the GSP-Spec parameters.
For log g, we found that GSP-Spec log g values for stars with literature log g ~ 4.5 exhibit a broad distribution extending up to ~4.8. The cause of this discrepancy is unclear, but it is possibly related to model-grid issues in GSP-Spec and/or in the literature. Given that the three literature sources employed high-resolution and high-S/N spectra and that the trends between GSP-Spec and literature log g are similar among the three studies, we decided to fit the GSP-Spec and literature log g data with a smoothly connected broken line. The choice of relying on the literature values is supported by the fact that there is a good linear relation between log g in the three literature sources and bolometric luminosity (and hence evolutionary log g). The obtained relation is
 (A.1)
(A.1)
 (A.2)
(A.2)
 (A.3)
(A.3)
where x and y represent the GSP-Spec parameters with the calibration described by Recio-Blanco et al. (2024) and the literature parameters, respectively, Equations (A.1) and (A.2) correspond to the lines for smaller and larger log g, respectively, and Equation (A.3) represents a LogSumExp-type smooth minimum function with the parameter α arbitrary chosen as 20. Fitting to the data points shown in Fig. A.1 yields a2 = 0.133, b1 = 0.121, and b2 = 0.032. The fitted line is shown in the figure as the red thick line. Using Equation (A.3), we calibrated our GSP-Spec log g values and their errors.
Another possible approach, which we have not adopted here, would be to rely on the relative log g values of GSP-Spec, and simply add a 0.104 offset to the GSP-Spec log g values, ignoring the broken relation seen in Fig. A.1. This alternative might be supported by the seemingly linear relations with unit slope between GSP-Spec log g and those determined by Gonzalez et al. (2010), Gonzalez (2014), Porto de Mello et al. (2014), and Spina et al. (2021) up to log g~4.5-4.6.
Appendix B Further interpolation of the isochrone library
To accurately recover the age (and Mini) of a solar twin, the HR diagram and the Kiel diagram need to be densely covered with isochrone grid points, with a spacing comparable to or smaller than the observational uncertainties. The uncertainties of [M/H], Teff, log g, MG, and MKs in our final solar twin catalog are 0.01-0.06dex, ~20-100K, 0.01-0.1, 0.003-0.05, and 0.02-0.03, respectively, for most stars (5% and 95% percentiles). The steps in the isochrone library should ideally be comparable to, or finer than, the minimum values of these precision ranges (e.g., finer than 20 K). The condition for [M/H] is satisfied, given that we retrieved the isochrone library with 0.005 dex increments in [M/H]ini. Hence, we here check the increments of the other four parameters.
Our selection of solar twins covers both main-sequence stars and old main-sequence turn-off stars. For turn-off stars, our grid with 0.1 Gyr increments retrieved from the CMD 3.7 web interface provides sufficiently high density on the Teff vs log g Kiel diagram. Indeed, for the 10 Gyr isochrone, the age difference of 0.1 Gyr at the turn-off corresponds to a Teff difference of 5 K, which is a few times finer than the best Teff precision. Also, the log g spacing around the turn-off is small, ≲0.05, owing to the fine Mini increment of ≲0.01 M⊙ around there, which is comparable to the upper 5% percentile of the log g precision of 0.045. Still, the MG and MKs spacing around the turn-off of ~0.1 mag is an order worse than the typical precision of our photometric data.
In contrast, the Mini increments in the retrieved grid for main-sequence stars are not fine enough for Teff, MG, and MKs. The Mini increments for main-sequence stars range from <0.01 to 0.05M⊙. The resulting log g step at 1 M⊙ is up to ~0.03, which is sufficient for recovering ages. However, given |∂Teff/∂Mini| ~ 3500K/M⊙ along main-sequence isochrones, the Teff step becomes >150K in the worst cases, which is several times coarser than the typical observational Teff precision. Similarly, gradients of MG and MKs of 5-8 and 3-7 mag/M⊙, respectively, correspond to steps of ~0.4mag in the worst cases. These coarse Teff, MG and MKs steps are particularly evident in young isochrones with ages ≲1.5 Gyr, where Mini increments are typically 0.05M⊙. Thus, if we were to determine ages and Mini using the retrieved isochrone grid as it is, the likelihood would tend to place most of the weight on the nearest Mini grid points, even when the true value lies between them, thereby pulling the inferred Mini toward those grid points and introducing systematic biases. Once Mini is biased in this way, the simultaneously inferred age is biased as well, despite the fine age grid.
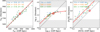 |
Fig. A.1 Our Gaia DR3 GSP-Spec and literature stellar parameters of solar twins. GSP-Spec parameters were already calibrated following Recio-Blanco et al. (2024). Blue circles, orange triangles, and green squares represent comparisons with Tucci Maia et al. (2016, T16; 37 stars), Nissen et al. (2020, N20; 16 stars), and Shejeelammal et al. (2024, S24; 43 stars), respectively. Typical quoted errors are ~5-10K in Teff, 0.02 in log g, and 0.005-0.01 dex in [M/H], for both GSP-Spec and literature parameters. Only stars with literature parameters satisfying our solar twin criteria are shown (i.e., stars in gray-shaded areas are excluded). The red open marker indicates the parameters of the Sun. Red thick lines show our adopted relations to convert GSP-Spec parameters to the literature scales. The scatters around the adopted relations are annotated in each panel. |
In order to overcome the issue of the coarse grid, we added isochrone points with 0.001 M⊙ increments, by linearly interpolating existing isochrone grid points. The resulting maximum steps of Teff, log g, MG, and MKs along the isochrones are ~4K, 0.003, 0.01 mag, and 0.01 mag, respectively.
Appendix C Mimicking the errors in stellar parameters
In Sect. 4.3.1, we constructed a mock catalog of solar twins, by mimicking the observed stellar parameters, for which errors had to be assigned. To guide this assignment, we first investigated how S/N depends on magnitude and stellar parameters. We then examined how the errors in six parameters (Teff, log g, [M/H], [α/Fe], MG and MKs) in our solar twin catalog depend on the stellar parameters (Teff, log g, and [M/H]) and on S/N. We note that here we use the “original” values (i.e., those before the calibration in Appendix A) for the log g error, while we use the “calibrated” values for the other parameters including log g itself. We also note that for [M/H] and its error, we use the values before correcting for the effect of [α/Fe].
For the sample in this section, we considered 27 782 Gaia DR3 stars that (1) have the first 13 GSP-Spec Quality Flags, except for the seventh one, equal to zero, (2) have parameters that pass our solar twin selections in Sects. 2.1 and 2.4, and (3) satisfy G < 12. These conditions are intended to avoid imposing any threshold on parameterization uncertainties, thereby allowing stars with large uncertainties to be included.
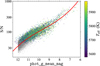 |
Fig. C.1 Dependence of S/N on the G-band magnitude. Dots color coded by Teff show our final 6594 solar twins, while gray dots represent 27 782 stars without imposing the condition on the seventh digit of the GSP-Spec Quality Flags on parameterization uncertainties. Red thick curve shows the cubic polynomial relation between the G-band magnitude and the common logarithm of S/N, obtained by fitting the gray data points. |
Figure C.1 shows the relation between the G-band magnitude and the common logarithm of S/N. We see no dependence of this relation on Teff, as shown by the colored dots (i.e., our final 6594 solar twins) in the figure. We also see no dependence on log g or [M/H], though these are not shown in the figure. In contrast, we see a clear lower boundary of S/N around 50 in the final sample, which is the result of the seventh digit of GSP-Spec Quality Flag (i.e., upper thresholds on the parameterization uncertainties of Teff, log g, [M/H], and [α/Fe]). To properly account for this selection criterion, we fitted the gray dots in Fig. C.1 (i.e., the sample without imposing the thresholds on parameterization uncertainties, namely the sample defined in this section) and
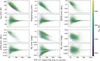 |
Fig. C.2 Dependence of the errors in stellar parameters on S/N and Teff. |
Linear coefficients in Equation (C.2) to estimate the errors in solar twin parameters as a function of S/N and some stellar parameters.
obtained the relation
 (C.1)
(C.1)
for which the RMS scatter around the relation is 0.0960.
With the G-S/N relation obtained, to mimic the relations between S/N and parameterization uncertainties, we show vertically arranged pairs of panels plotting the errors in the six parameters for our sample in Fig. C.2. The upper panel of each pair shows the relation between S/N (rv_expected_sig_to_noise from the Gaia DR3 catalog) and the error. As can be seen, there are good linear relations between the logarithms of the horizontal and vertical axes for most panels, indicating power-law relations between the S/N and error values. There are two exceptions: the errors in MG and MKs. For MG, the error is in many cases dominated by the error in the extinction AG, which is determined using Gaia photometry and GSP-Spec stellar parameters. Hence, the error in MG mainly depends on AG and the errors in GSP-Spec stellar parameters. The latter correlates well with S/N, as illustrated in the other panels, but the former depends only weakly on S/N through the distance. As a result, the trend between S/N and the MG error has a large scatter. For MKs, the error is mostly dominated by the error in the 2MASS photometry, and hence it depends only weakly on the S/N.
The dependence of the errors on other parameters (Teff, log g, and [M/H]) is illustrated by the colors of the dots in Figs. C.2, C.3, and C.4, respectively. There is clear dependence of the errors of most parameters on Teff, and some of them also (in most cases weakly) depend on log g and [M/H] on top of the dependence on Teff. Again, the error of MKs is an exception, which depends only weakly on Teff but does not on log g nor [M/H].
To model the dependence of the errors on S/N and stellar parameters, we fitted the common logarithms of the errors as linear functions of the form
![Mathematical equation: \begin{split} &\log _{10}(\mathrm{Error}) = a_{0} + a_{\mathrm{S/N}}^{}\log _{10}(\mathrm{S/N}) + a_{T_{\mathrm{eff}}}^{}\frac{T_{\mathrm{eff}} - T_{\mathrm{eff},\odot}}{100\ur{K}} \notag \\ &\quad + a_{{T_{\mathrm{eff}}}^{2}}^{}\left(\frac{T_{\mathrm{eff}} - T_{\mathrm{eff},\odot}}{100\ur{K}}\right)^{2} + a_{\log g}^{}\frac{\log g-\log g_{\odot }}{0.1} + a_{\mathrm{[M/H]}}^{}\frac{\mathrm{[M/H]}}{0.1\ur{dex}}\text{,} \label{Eq:LinearErrorCoef} \end{split}](/articles/aa/full_html/2026/03/aa58913-26/aa58913-26-eq27.png) (C.2)
(C.2)
using least-squares minimization. We fixed some coefficients to zero when visual inspection showed no clear dependence of an error on a parameter and when allowing the coefficients to vary produced negligible improvements in the root-meansquares (RMS) of the fitting residuals. The resulting coefficients and RMS values of the fits are summarized in Table C.1. We used Equations (C.2) and (C.1), together with their scatter, to assign errors to mock solar twins.
Appendix D Review of previous large solar twin catalogs
In recent years, a few large catalogs of solar twins have been published using spectra from large surveys. Rampalli et al. (2024) analyzed Gaia RVS spectra of solar twins published in DR3 (Cropper et al. 2018; Gaia Collaboration 2023c) with a data-driven approach using The Cannon algorithm (Ness et al. 2015) to infer the stellar parameters and chemical abundances of 15 elements for 5347 solar twins (in our definition). They used high-resolution stellar parameters and chemical abundances of 34 solar twins from Hinkel et al. (2014), Brewer et al. (2016), Brewer & Fischer (2018), and Bedell et al. (2018) as the reference during the training, among which most of the training stars are from Brewer et al. (2016) and Brewer & Fischer (2018). Among the four studies, only Bedell et al. (2018) focused exclusively on solar twins, but given that Brewer et al. (2016) and Brewer & Fischer (2018) analyzed their high-resolution spectra with a differential analysis method, their parameters might be as reliable as those in studies focusing specifically on solar twins. They achieved high internal precisions of 0.03-0.07 dex for many elements, supporting the effectiveness of the data-driven The Cannon method. Then, Rampalli et al. (2024) estimated isochrone ages using the isoclassify code (Huber et al. 2017; Berger et al. 2020), with Teff, log g, and [Fe/H] as input parameters, though they mentioned that they do not report their ages “as robust results for individual stars”. By plotting condensation temperature Tc-abundance trends, they independently confirmed that the Sun is depleted in refractory elements compared to their sample of solar twins, regardless of whether those stars host terrestrial, close-in giant, or giant planets, or no planets at all.
There are also two large catalogs of solar twins based on GALAH DR3 (Buder et al. 2021) data. As one of these two studies, Walsen et al. (2024) applied the data-driven The Cannon algorithm (Ness et al. 2015) to GALAH DR3 spectra to derive high-precision stellar parameters and 14 elemental abundances for a sample of 13 132 solar twins (again, in our definition). They used stellar parameters and abundances from GALAH DR3 of 150 high-S/N stars, for which a sky-flat solar spectrum was used to determine the zero-point in the chemical abundances, as the reference, though it is not clearly stated which parameters have been corrected for these zero-points. They also used GALAH DR3 abundances together with their derived The Cannon abundances, to see whether there are any differences between the results obtained with the two abundance catalogs. They adopted ages tabulated in GALAH DR3 (Sharma et al. 2018; Buder et al. 2021), though Buder et al. (2021) and Walsen et al. (2024) noted a few limitations in the GALAH DR3 ages, for example, the overestimation of the solar age by 1.26 Gyr. With these datasets, they compared the age-[X/Fe] relations for their sample to those from Bedell et al. (2018). They claimed that some elements (Mg, Al, Si, Ca, Sc, Ti, and Zn) show consistent trends between the two samples, whereas some others (Na, Mn, Ni, Cu, Y, and Ba) show inconsistent trends, and argued that the discrepancies could be due, for example, to differences in precision and accuracy, distance range, or selection effects. At the same time, we suggest that the discrepancies that they found could be at least partly attributed to differences in the age range (~0-8 Gyr in Bedell et al. (2018) vs ~3-12Gyr in Walsen et al. (2024) and in the metallicity range (±0.1 dex around the solar value by Bedell et al. (2018) vs ±0.3 dex by Walsen et al. (2024). They then constructed phylogenetic trees from [X/Fe] ratios to investigate the evolution of Galactic-disk stars. From the phylogenetic tree constructed from the combination of low- and high-eccentricity solar twins, they found that there are two distinct clans that differ in eccentricities, metallicities, and chemical-clock relations (i.e., the age-[Y/Mg] relation).
In the other study using GALAH DR3, Lehmann et al. (2025) applied the equivalent-width-based data-driven EPIC algorithm (Lehmann et al. 2022) to derive precise Teff, log g, and [Fe/H] for a large sample of solar twins (14 571 stars in our definition). They employed the stacked GALAH DR2 spectra (Zwitter et al. 2018), whose stellar parameters had been determined using The Cannon by Buder et al. (2018)19, as the reference training sample. They achieved a factor of 2-4 higher precision (i.e., smaller errors) in the parameterization compared to the original GALAH pipeline. They then estimated isochrone ages with the SAMD code (Sahlholdt 2020) and used these ages together with orbital parameters to investigate the chemodynamic evolution of nearby moving groups defined as solar twins having a common angular momentum Lz. In particular, they examined the age-metallicity relation for each moving group, without imposing the usual restriction of nearly solar metallicity, to study radial migration within a moving group.
Appendix E Additional tables and figures
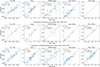 |
Fig. E.1 Comparison of stellar parameters with literature (Tucci Maia et al. 2016; Nissen et al. 2020; Shejeelammal et al. 2024). Each panel shows a comparison for Teff, log g, [M/H] (or [Fe/H]), age, and Mini, from left to right. Three values are annotated: the number N of stars in common between this work and literature, the mean difference ∆ and the standard deviation σ of the difference between this work and literature. Also available at Zenodo (https://doi.org/10.5281/zenodo.18408912). |
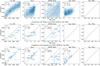 |
Fig. E.2 Same as Fig. E.1 but for three other studies (Walsen et al. 2024; Lehmann et al. 2025; Rampalli et al. 2024). |
Column description of the published solar twin catalog.
Added offsets to [X/Fe] abundances.
All Tables
Linear coefficients in Equation (C.2) to estimate the errors in solar twin parameters as a function of S/N and some stellar parameters.
All Figures
|
Fig. 1 Some parameters of theoretical isochrones (top) and observed solar twin candidates (bottom). The horizontal axes in all the panels represent Teff, while the vertical axes represent some other parameters (log g, MG, MKs, and (J - Ks)⊙). Cyan dots in the upper panels show the isochrone grid points satisfying −0.1 < [M/H]curr < +0.1 dex. Blue dots in the upper panels show a subset of them having Teff and log g between ±200 K and ±0.2 around the solar values, which is the selection criterion of our solar twin candidates in Sect. 2.1 and is represented as a rectangle outlined with black dashes in the left panels. The trapezoids outlined in black dashes in the rest of the panels show the selection criteria for good solar twins in Sect. 2.4. Dots in the lower panels show the parameters of the 7775 observed solar twin candidates with good distances and 2MASS data. Orange dots in the lower panels show a subset of solar twins that do not satisfy the selection criteria (i.e., outside of the trapezoids). Red crosses show the reference solar values provided in Sect. 4.1 and (J - Ks)⊙ = 0.40 (Willmer 2018). We note that several outliers of observed solar twin candidates fall outside the plotted range and are not shown in the figures. |
| In the text | |
|
Fig. 2 Recovered parameters in the resulting observed solar twin catalog. Each panel shows a scatter plot between the determined age, τ, and initial mass, Mini, color coded by the relative age error. Left, middle, and right panels show the results obtained when using log g, MG, and MKs, respectively. as the third input parameter in addition to [M/H]curr and Teff. |
| In the text | |
|
Fig. 3 Recovered parameters in the mock catalog of solar twins. We show only random 6594 mock stars, i.e., the same number of stars as in the observed solar twin catalog. All the panels are defined in the same way as in Fig. 2. |
| In the text | |
|
Fig. 4 Comparison between the observed (blue) and mock (orange) solar twin catalogs in different age bins. Top, middle, and bottom panels show results for twins with the determined ages between 1-2, 4-5, and 7-8 Gyr, respectively. Left, middle, and right panels correspond to ages determined using log g, MG, and MKs, respectively, as the third input parameter together with [M/H]curr and Teff. In each panel, the histograms show the probability density of the initial mass Mini (i.e., the normalized number of twins per Mini bin), while line plots show the median relative age errors in each Mini bins. |
| In the text | |
|
Fig. 5 Comparison between the solar twin ages determined with log g, MG, and MKs, color coded by Teff. |
| In the text | |
|
Fig. 6 Age-abundance relations for selected elements ([Al/Fe], [Si/Fe], [Ca/Fe], and [Y/Fe], from left to right). Blue dots show the GSP-Spec abundances of individual solar twins, while blue filled circles with error bars indicate the medians of [X/Fe] within each 1 Gyr age bin. Orange and green dots represent abundances from APOGEE DR17 (Majewski et al. 2017; Abdurro’uf et al. 2022) and GALAH DR4 (De Silva et al. 2015; Buder et al. 2025), respectively. The thick red line shows the linear age-abundance relation by Bedell et al. (2018) for comparison. Red filled circles and an open circle at 6.4 Gyr with error bars represent old α-enhanced stars and an s-enhanced star, respectively, from Spina et al. (2018) and Bedell et al. (2018). For each element from each survey, we applied a zero-point correction in [X/Fe] to make the abundance scale consistent with that of the age-[X/Fe] relation by Bedell et al. (2018). The ages are determined using the Ks-band magnitude, and only stars with relative age errors smaller than 50% are included. For APOGEE DR17 and GALAH DR4, we include only stars with abundance errors below 0.05 dex. We note that a small fraction of blue dots as well as one [Al/Fe] measurement from APOGEE DR17 and one [Al/Fe] measurement from GALAH DR4 fall outside the plotted range and are therefore not shown. Plots for all the elements are presented in Fig. E.3. |
| In the text | |
|
Fig. A.1 Our Gaia DR3 GSP-Spec and literature stellar parameters of solar twins. GSP-Spec parameters were already calibrated following Recio-Blanco et al. (2024). Blue circles, orange triangles, and green squares represent comparisons with Tucci Maia et al. (2016, T16; 37 stars), Nissen et al. (2020, N20; 16 stars), and Shejeelammal et al. (2024, S24; 43 stars), respectively. Typical quoted errors are ~5-10K in Teff, 0.02 in log g, and 0.005-0.01 dex in [M/H], for both GSP-Spec and literature parameters. Only stars with literature parameters satisfying our solar twin criteria are shown (i.e., stars in gray-shaded areas are excluded). The red open marker indicates the parameters of the Sun. Red thick lines show our adopted relations to convert GSP-Spec parameters to the literature scales. The scatters around the adopted relations are annotated in each panel. |
| In the text | |
|
Fig. C.1 Dependence of S/N on the G-band magnitude. Dots color coded by Teff show our final 6594 solar twins, while gray dots represent 27 782 stars without imposing the condition on the seventh digit of the GSP-Spec Quality Flags on parameterization uncertainties. Red thick curve shows the cubic polynomial relation between the G-band magnitude and the common logarithm of S/N, obtained by fitting the gray data points. |
| In the text | |
|
Fig. C.2 Dependence of the errors in stellar parameters on S/N and Teff. |
| In the text | |
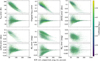 |
Fig. C.3 Same as Fig. C.2, but color coded by calibrated log g. |
| In the text | |
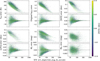 |
Fig. C.4 Same as Fig. C.2, but color coded by [M/H]. |
| In the text | |
|
Fig. E.1 Comparison of stellar parameters with literature (Tucci Maia et al. 2016; Nissen et al. 2020; Shejeelammal et al. 2024). Each panel shows a comparison for Teff, log g, [M/H] (or [Fe/H]), age, and Mini, from left to right. Three values are annotated: the number N of stars in common between this work and literature, the mean difference ∆ and the standard deviation σ of the difference between this work and literature. Also available at Zenodo (https://doi.org/10.5281/zenodo.18408912). |
| In the text | |
|
Fig. E.2 Same as Fig. E.1 but for three other studies (Walsen et al. 2024; Lehmann et al. 2025; Rampalli et al. 2024). |
| In the text | |
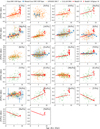 |
Fig. E.3 Age-abundance relations for all the elements. Symbols are the same as in Fig. 6. |
| In the text | |
Current usage metrics show cumulative count of Article Views (full-text article views including HTML views, PDF and ePub downloads, according to the available data) and Abstracts Views on Vision4Press platform.
Data correspond to usage on the plateform after 2015. The current usage metrics is available 48-96 hours after online publication and is updated daily on week days.
Initial download of the metrics may take a while.