Fig. 4
Download original image
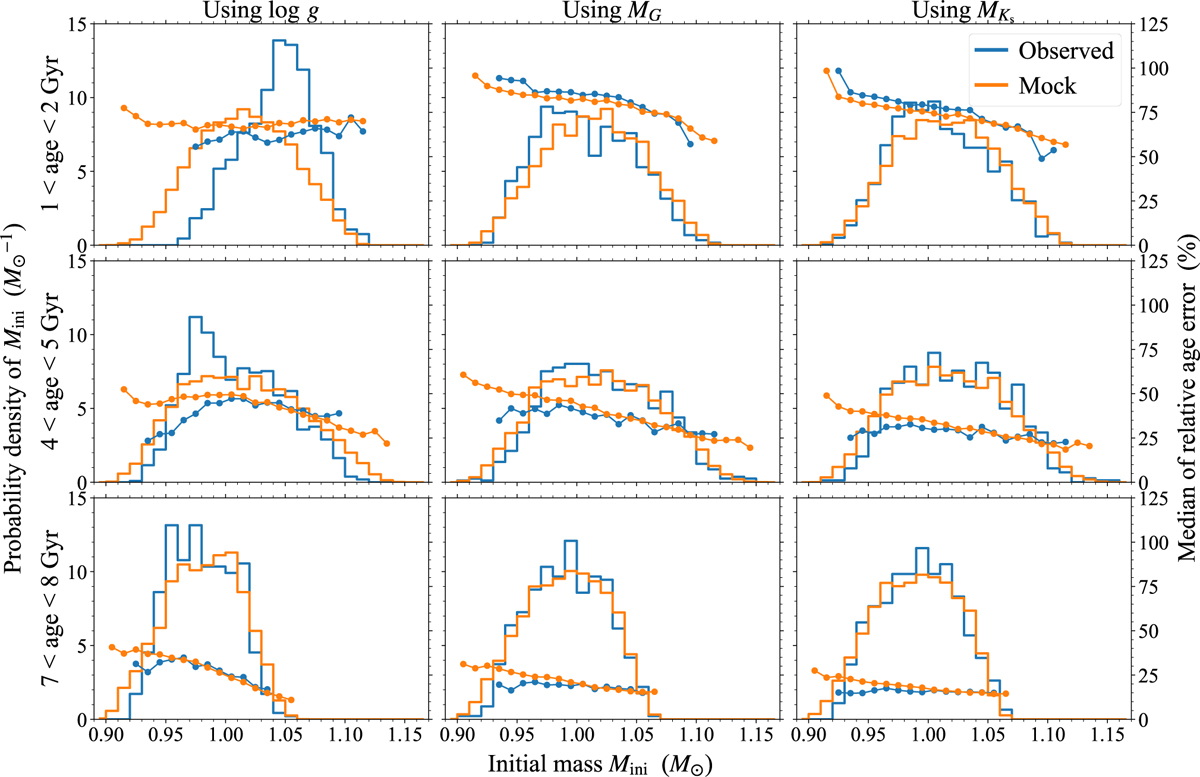
Comparison between the observed (blue) and mock (orange) solar twin catalogs in different age bins. Top, middle, and bottom panels show results for twins with the determined ages between 1-2, 4-5, and 7-8 Gyr, respectively. Left, middle, and right panels correspond to ages determined using log g, MG, and MKs, respectively, as the third input parameter together with [M/H]curr and Teff. In each panel, the histograms show the probability density of the initial mass Mini (i.e., the normalized number of twins per Mini bin), while line plots show the median relative age errors in each Mini bins.
Current usage metrics show cumulative count of Article Views (full-text article views including HTML views, PDF and ePub downloads, according to the available data) and Abstracts Views on Vision4Press platform.
Data correspond to usage on the plateform after 2015. The current usage metrics is available 48-96 hours after online publication and is updated daily on week days.
Initial download of the metrics may take a while.