Fig. 6
Download original image
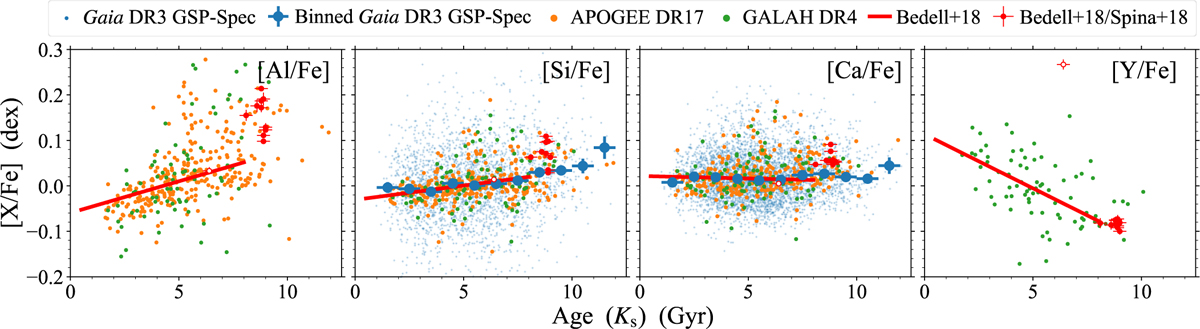
Age-abundance relations for selected elements ([Al/Fe], [Si/Fe], [Ca/Fe], and [Y/Fe], from left to right). Blue dots show the GSP-Spec abundances of individual solar twins, while blue filled circles with error bars indicate the medians of [X/Fe] within each 1 Gyr age bin. Orange and green dots represent abundances from APOGEE DR17 (Majewski et al. 2017; Abdurro’uf et al. 2022) and GALAH DR4 (De Silva et al. 2015; Buder et al. 2025), respectively. The thick red line shows the linear age-abundance relation by Bedell et al. (2018) for comparison. Red filled circles and an open circle at 6.4 Gyr with error bars represent old α-enhanced stars and an s-enhanced star, respectively, from Spina et al. (2018) and Bedell et al. (2018). For each element from each survey, we applied a zero-point correction in [X/Fe] to make the abundance scale consistent with that of the age-[X/Fe] relation by Bedell et al. (2018). The ages are determined using the Ks-band magnitude, and only stars with relative age errors smaller than 50% are included. For APOGEE DR17 and GALAH DR4, we include only stars with abundance errors below 0.05 dex. We note that a small fraction of blue dots as well as one [Al/Fe] measurement from APOGEE DR17 and one [Al/Fe] measurement from GALAH DR4 fall outside the plotted range and are therefore not shown. Plots for all the elements are presented in Fig. E.3.
Current usage metrics show cumulative count of Article Views (full-text article views including HTML views, PDF and ePub downloads, according to the available data) and Abstracts Views on Vision4Press platform.
Data correspond to usage on the plateform after 2015. The current usage metrics is available 48-96 hours after online publication and is updated daily on week days.
Initial download of the metrics may take a while.