Fig. C.1
Download original image
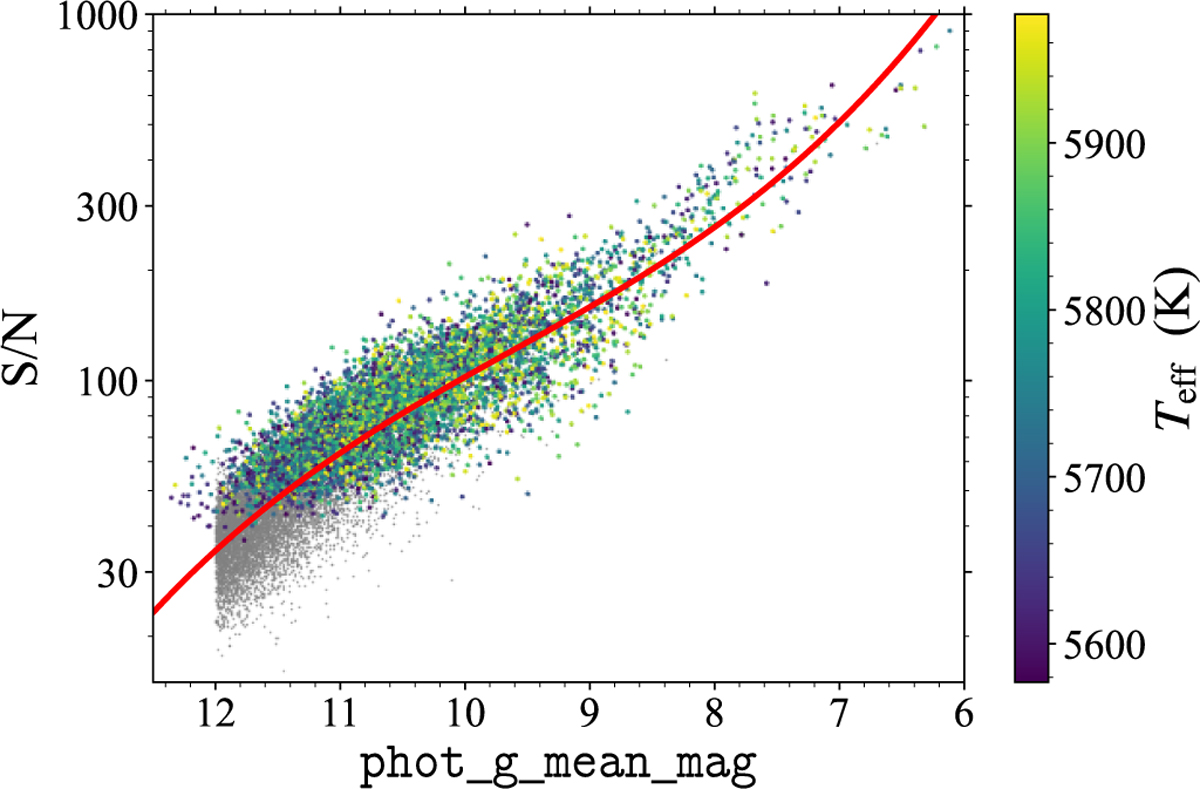
Dependence of S/N on the G-band magnitude. Dots color coded by Teff show our final 6594 solar twins, while gray dots represent 27 782 stars without imposing the condition on the seventh digit of the GSP-Spec Quality Flags on parameterization uncertainties. Red thick curve shows the cubic polynomial relation between the G-band magnitude and the common logarithm of S/N, obtained by fitting the gray data points.
Current usage metrics show cumulative count of Article Views (full-text article views including HTML views, PDF and ePub downloads, according to the available data) and Abstracts Views on Vision4Press platform.
Data correspond to usage on the plateform after 2015. The current usage metrics is available 48-96 hours after online publication and is updated daily on week days.
Initial download of the metrics may take a while.