| Issue |
A&A
Volume 707, March 2026
|
|
|---|---|---|
| Article Number | L11 | |
| Number of page(s) | 8 | |
| Section | Letters to the Editor | |
| DOI | https://doi.org/10.1051/0004-6361/202658914 | |
| Published online | 12 March 2026 | |
Letter to the Editor
Solar twins in Gaia DR3 GSP-Spec
II. Age distribution and its implications for the Sun’s migration
1
National Astronomical Observatory of Japan 2-21-1 Osawa Mitaka Tokyo 181-8588, Japan
2
Department of Physics, Tokyo Metropolitan University 1-1 Minami-Osawa Hachioji Tokyo 192-0397, Japan
3
Université Côte d’Azur, Observatoire de la Côte d’Azur, CNRS, Laboratoire Lagrange, Bd de l’Observatoire CS 34229 06304 Nice cedex 4, France
★ Corresponding authors: This email address is being protected from spambots. You need JavaScript enabled to view it.
; This email address is being protected from spambots. You need JavaScript enabled to view it.
Received:
10
January
2026
Accepted:
9
February
2026
Abstract
Solar twins are among the most powerful tracers of Galactic disk evolution owing to their unique property of sharing nearly solar metallicities ([Fe/H] ≈ 0) while spanning a wide range of ages. To grasp solar twins as relics of Galaxy evolution, individual twins must be tagged with ages. A sufficiently large and well-characterized stellar sample then allows us to construct an age distribution that encodes the star formation history beyond our local region, modulated by the efficiency of radial migration of stars. Based on our catalog of 6594 high-quality local (≲300 pc) solar twins from the Gaia Data Release 3 spectroscopic (GSP-Spec) catalog, we derived their age distribution after carefully deconvolving the selection function. We find two distinct features: a narrow peak around ∼2 Gyr and a broad bump extending over ∼4 − 6 Gyr. First, we argue that the former corresponds to a relatively recent burst of star formation that occurred in the disk, including at least a local region within a few kiloparsecs of the Sun, which is in good agreement with previous results deduced from independent works. On the other hand, the older bump, closely associated with the Sun’s birth epoch, is intriguing since this finding challenges the predicted presence of a corotation barrier built by the Galactic bar, which is thought to prevent stars born inside RGC ≈ 6 kpc from reaching the solar neighborhood. We propose that the large number of local twins with ages between 4 and 6 Gyr provides compelling evidence that the Sun’s long-distance (≥3 kpc) migration is shared by many inner disk stars. This, in turn, suggests a possible link with the epoch of bar formation, which may have triggered enhanced star formation in the inner disk and induced efficient radial migration.
Key words: stars: solar-type / stars: statistics / Galaxy: disk / Galaxy: evolution / Galaxy: kinematics and dynamics
The Tokyo Center For Excellence Project, Tokyo Metropolitan University.
© The Authors 2026
 Open Access article, published by EDP Sciences, under the terms of the Creative Commons Attribution License (https://creativecommons.org/licenses/by/4.0), which permits unrestricted use, distribution, and reproduction in any medium, provided the original work is properly cited.
This article is published in open access under the Subscribe to Open model. This email address is being protected from spambots. You need JavaScript enabled to view it. to support open access publication.
1. Introduction
Clear answers to the question of how the Galaxy disk forms and evolves through cosmic time continue to elude us. Recent studies have deepened the mystery via findings of the Galaxy’s complex structure and history, rendering our simplistic initial picture outdated (e.g. Hayden et al. 2015; Xiang & Rix 2022). As an established scheme, the Galactic disk is composed of two distinguishable populations in terms of chemistry and/or kinematics, the so-called thick and thin disks (e.g., Bland-Hawthorn & Gerhard 2016, for a review); however, it is still debatable how each disk was formed and whether their origins are connected. Of the two disks, the thin disk lies at the forefront of Galaxy formation, not least because most stars are in the thin disk today. The discovery of very metal-poor ([Fe/H] < −2.5) thin disk stars (e.g., Sestito et al. 2020) including a RR Lyrae star (> 10 Gyr old) by Matsunaga et al. (2022) suggests that the thin disk may have extended back to the early days of the Galaxy. This finding is closely tied to the debated origin of these stars (e.g., Sestito et al. 2021; Belokurov & Kravtsov 2022; Bellazzini et al. 2024; Li et al. 2024), highlighting the complex history of disk (for simplicity, we hereafter refer to the thin disk as the disk).
More than two decades ago, it had already been suggested that star formation in the disk exhibits a complex history, with several bursts having taken place in the past (Rocha-Pinto et al. 2000). Since then, this view has become more compelling, aided by the growing body of observational data thanks, in part, to large surveys (e.g., Mor et al. 2019; Xiang & Rix 2022), as well as the advancement in techniques for determining the star formation history (e.g., Gallart et al. 2005). In particular, the Gaia mission has made a breakthrough in this field by providing precise measurements of stellar parallaxes, which have dramatically improved the quality of the color-magnitude diagram (Gaia Collaboration 2018). This update leads to a more accurate reconstruction of the star formation history, revealing clear evidence of episodic (bursting) star formation in the disk throughout much of cosmic time, including the events around ∼2 and ∼6 Gyr ago (Ruiz-Lara et al. 2020). This finding has promoted the argument that the bursting events could have been triggered by episodic encounters between the Sagittarius (Sgr) dwarf galaxy and the Galaxy. It supports a dynamic perspective in which the complex history of the Galaxy disk is shaped by external influences, possibly beginning with a major impact from Gaia-Enceladus (Helmi et al. 2018; Belokurov et al. 2018).
In addition, the emerging paradigm of Galactic dynamics highlights the crucial role of internal interactions between stars and the Galactic structure within the disk in shaping its evolution: stars migrate radially across the disk through resonant scattering with spiral arms and the central bar over their lifetimes (e.g., Sellwood & Binney 2002; Roškar et al. 2008; Schönrich & Binney 2009; Minchev & Famaey 2010). This so-called radial migration of stars predicts that the birthplaces of a considerable number of disk stars differ from their current positions, and that the stars in the solar vicinity are a mixture of populations born at a wide range of Galactocentric distances (RGC) across the disk. Accordingly, the renewed view of Galactic dynamics suggests that the locally determined star formation history is, in fact, the outcome of a complex assembly of Galactic internal and external events that have occurred across nearly the entire disk over cosmic time.
In this context, it is of particular importance to classify local stars according to their approximate birth radii within the disk. This can in fact be achieved through chemical tagging combined with stellar age estimates, based on our conventional understanding that the chemical evolution of the disk varies with RGC, resulting in a distinct age-metallicity relation for each radius. This view is observationally evidenced by current radial abundance gradients showing a higher metallicity at smaller RGC values. Such a negative abundance gradient is naturally explained in the context of galaxy formation, with the inner region forming faster and becoming more metal-rich than the outer region – a process known as the inside-out scenario (Chiappini et al. 2001). In other words, the rate at which metallicity reaches a given value, such as the solar metallicity, increases with decreasing RGC.
There exist stars nearly identical to the Sun, so-called solar twins, which exhibit stellar atmospheric characteristics, including metallicity, quite similar to the solar values. Bedell et al. (2018) demonstrate that local 79 solar twins exhibit a tight correlation between the [X/Fe] ratios (where X ranges from C to Dy) and stellar ages widely distributed from 0 to 9 Gyr. Furthermore, this correlation is shown to be interpreted on the basis of the age–RGC connection within the framework of Galactic chemical evolution (Tsujimoto 2021). Then, suppose that a statistically sufficient number of age-tagged solar twins were in hand: we would be able to explore the Galaxy disk’s past through a novel methodology, one that could allow us to probe a vast region, including the unexplored innermost disk (Plotnikova et al. 2024). The best way to get as large as possible a catalog of good solar twin candidates is to dig into the catalogs published by the large spectroscopic surveys. The largest one in number is the homogeneous General Stellar Parametrizer from Spectroscopy (GSP-Spec) catalog collected from space by the ESA/Gaia mission and published as part of the third Gaia data release (DR3, Recio-Blanco et al. 2023). GSP-Spec relies on the analysis of ∼5.6 million Gaia/Radial Velocity Spectrometer stellar spectra.
We emphasize that the number of local solar twins as a function of stellar age represents a specific fraction of stars formed at their birth radii that were able to migrate to the solar vicinity, governed by the efficiency of radial migration. In this context, particular attention should be paid to a potential dynamical mechanism that could hinder the outward migration of stars from the inner disk: the Galactic bar creates a corotation barrier due to constraints imposed by the conservation of Jacobi energy (Binney & Tremaine 2008). This mechanism would predict a significantly reduced number of old solar twins in the solar neighborhood. A representative case is provided by numerical simulations investigating the Sun’s migration from its presumed birth radius of RGC ≈ 5 kpc (Tsujimoto & Baba 2020; Baba et al. 2024). These studies suggest that only ∼1% or fewer of stars sharing the Sun’s birth radius are able to reach the solar vicinity within the Sun’s lifetime of 4.6 Gyr. Indeed, the age distribution of solar twins may serve as a critical test of this hypothesis.
2. Derivation of intrinsic age distribution
From the Gaia DR3 GSP-Spec catalog, Taniguchi et al. (2026, hereafter Paper I) built a catalog of 6594 solar twins with a well-characterized selection function. Accurate ages of individual twins were estimated with the isochrone-projection method, in which the observed Teff, [M/H], and either log g, MG, or MKs1 were compared against PARSEC isochrones version 1.2S (Bressan et al. 2012; Chen et al. 2015). The resultant catalog, which covers a volume of ∼20 − 300 pc, is two orders of magnitude larger than the previous ones that observed individual stars one by one (see Table 2 in Paper I). Paper I also constructed a mock catalog to characterize the observational selection effects (see Sect. 4.3 in Paper I for details).
The purpose of this Letter is to derive the “intrinsic” age distribution of migrated stars, which is defined as the product of the star formation rate at their birth radii and the migration efficiency. For this purpose, we first obtained a rough estimate of the intrinsic age distribution of solar twins from the ratio of the observed (blue) to mock (orange) age histograms shown in Fig. B.1. In addition, we deconvolved the selection function from the observed solar twin age histogram using two independent approaches: regularized least-squares (RLS) inversion and Richardson-Lucy (RL) iterative deconvolution methods (see Appendix B for details). The results obtained with the three methods are shown in Fig. 1 by blue, orange, and green lines.
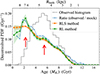 |
Fig. 1. (Deconvolved) probability density function (PDF) of the ages of solar twins determined with MKs. The dotted black line shows the normalized age histogram of our solar twin catalog (same as the blue histogram in Fig. B.1). The blue line shows the normalized ratio between the observed and mock age histograms, as a rough estimate of the intrinsic age distribution. Orange and green lines represent the deconvolved, intrinsic age distributions obtained using the two different (RLS and RL) methods. Shaded regions indicate the statistical uncertainty in the deconvolved PDFs, estimated from 104 Monte Carlo realizations assuming Poisson statistics for the original age histogram (see Appendix C for a validation of this uncertainty estimate). The upper axis provides reference Rbirth values, based on the [Fe/H] = 0 dex slice of the age–Rbirth–[Fe/H] relation in Ratcliffe et al. (2023). See Fig. D.1 for results using log g and those using MG. |
We find that the overall shapes of the intrinsic age distributions are qualitatively similar: each shows at least two prominent peaks (or bumps, identified by red arrows in Fig. 1) around 2 Gyr and 4 − 6 Gyr, with the exception that the latter bump is not present in the distribution derived using the RLS method. In the following discussion, we focus on these features, although we note that an additional bump may also be present around 8 Gyr. Furthermore, the presence of solar twins as old as ∼10 Gyr suggests that the formation of the disk may have begun more than at least 10 Gyr ago.
3. Bimodal age distribution
The deduced age distribution exhibits a peak corresponding to young solar twins and a secondary bump comprising relatively old twins with ages of 4 − 6 Gyr. In this study, because the age uncertainty is as large as 2 Gyr, it is difficult to resolve the age distribution within the most recent 2 Gyr. However, we can at least conclude that the clear increase from ∼3 Gyr ago toward the present points to the existence of a dominant population of young solar twins at these ages. Several studies have reported peaks corresponding to relatively young local stars, such as at ∼2.5 Gyr ago (Mor et al. 2019; Sahlholdt et al. 2022; Chen & Prantzos 2025), as well as 1.9 and 1 Gyr ago (Ruiz-Lara et al. 2020). Considering the age uncertainties in our study, our results are broadly consistent with these findings over a relatively large volume of a few kiloparsecs, corresponding to the possible travel distances of 2 Gyr-old stars (approximately 1 − 1.5 kpc; Tsujimoto & Baba 2020), similar to the case of Ruiz-Lara et al. (2020). Note that our solar twin sample cannot probe very recent star formation, in contrast to previous studies based on samples that include OBA-type stars. Accordingly, we argue that a burst of star formation took place in the Galactic disk, encompassing at least the local region around 2 Gyr ago. It is worth reiterating here that its possible trigger is an interaction with the Sgr dwarf galaxy, which deserves further attention.
More intriguingly, we identify a bump feature formed by solar twins with ages of ∼4 − 6 Gyr. Evidence for enhanced star formation at these epochs has also been reported in previous studies (e.g., Ruiz-Lara et al. 2020; Gallart et al. 2024; del Alcázar-Julià et al. 2025)2. However, our result differs in one important respect: in our sample, the bump stars consist exclusively of stars that migrated from the inner disk, following the solar twin’s age–RGC relation, whereas in other studies where no metallicity constraint is imposed on sample selection, they represent a mixture of stars formed both in situ and in other regions of the disk. This broad coincidence between samples with and without in situ star formation can be reconciled with a framework that the locally inferred star formation history may have been substantially shaped by the effects of radial migration (e.g., Baba 2025). The question then arises of where these 4 − 6 Gyr-old stars migrated to the solar neighborhood from. The approximate birthplaces of such stars can be inferred from the studies so far, including the one illustrated in Fig. 1. It is worth emphasizing here that solar twins with ages ranging from 4.5 to 7 Gyr exhibit elemental abundance patterns that match the Sun’s almost perfectly (Tsujimoto 2021), suggesting that the bump stars likely share a very similar birth environment to that of the Sun.
Although some uncertainty remains in the estimated birth radius of the Sun, most studies broadly converge on a value of RGC < 6 kpc, with specific estimates including ∼4.5 kpc (Lu et al. 2024), ∼5 kpc (Ratcliffe et al. 2023; Baba et al. 2023), and ∼6 kpc (Prantzos et al. 2023), based on placing the Sun within the framework of Galactic chemical evolution. However, from the standpoint of Galactic dynamics, migration from such an inner region may not be sufficiently probable. This argument stems from the presence of the Galactic bar, which generates a potential barrier that makes it difficult for stars to migrate outward across the corotation radius (CR; Sellwood & Binney 2002; Ceverino & Klypin 2007; Di Matteo et al. 2013; Fragkoudi et al. 2019; Khoperskov et al. 2020), located around RGC ∼ 6 kpc (e.g., Portail et al. 2017; Sanders et al. 2019) under the slow-long-bar scenario (e.g., Hunt & Bovy 2018; Palicio et al. 2018). Nevertheless, the bar length and pattern speed remain open issues, with some studies favoring a short-fast-bar scenario (Dehnen 2000; Hunt et al. 2018). In addition, the Galactic bar is thought to be decelerating (Zhang et al. 2025; Dillamore & Sanders 2025), with an estimated present-day slowing rate of Ωp = −4.5 ± 1.4 km s−1 kpc−1 (Chiba et al. 2021). As a consequence of the mentioned potential barrier, the likelihood of such large-scale outward migration is expected to be quite low and has been estimated to be on the order of ∼1% or less (Tsujimoto & Baba 2020; Baba et al. 2024). This implies that only a negligible number of solar twins with ages close to that of the Sun (≈4 − 6 Gyr) should exist, given that their birthplaces lie within the corotation radius. Yet, contrary to this expectation, our derived age distribution shows no dip in this age range; instead, it exhibits a clear bump feature.
This naturally raises the question of what mechanism is responsible for producing such a feature. A plausible explanation is that a particular event or process temporarily enhanced the efficiency of radial migration in the inner disk. This scenario is reminiscent of the epoch of Galactic bar formation, which could have induced a coupling effect, simultaneously enhancing both radial migration efficiency (e.g., Friedli & Benz 1995) and star formation (e.g., Athanassoula 1992). In particular, the combined effect of the bar and the spiral-arm structure can induce stronger migration around the bar’s CR (Minchev & Famaey 2010, but see also Quillen (2003)). If this theoretical prediction applies, the bump feature in our age distribution may mark the onset of bar formation around 6 − 7 Gyr ago, with the forming bar remaining dynamically active for a few gigayears thereafter. As a result, the overall epoch associated with bar formation activity can be identified as the period ∼4 − 7 Gyr ago, corresponding approximately to the full extent of the bump feature. This inferred bar age is somewhat younger than the commonly cited value of ∼8 Gyr (e.g., Bovy et al. 2019); however, a recent study based on the ages of super-metal-rich stars suggests a much younger bar age of 3 − 4 Gyr (Nepal et al. 2024), partially overlapping with our estimate. Furthermore, a bar formation epoch around 4 Gyr ago has also been proposed from a perspective similar to ours (Ruiz-Lara et al. 2026). Our argument is supported by the recent finding of an inner stellar ring at the bar ends, which is composed of stars with metallicities approximately close to solar and ages overlapping with those of bump twins (Wylie et al. 2022).
Finally, we discuss the bimodality in the age distribution purely from the perspective of chemical evolution. If the thin disk formed as a secondary component after the thick disk, it is expected to have originated from super-metal-rich gas ([Fe/H] > 0), after which [Fe/H] would have decreased over time due to dilution by infalling metal-poor gas. This reverse evolution phase would have ended relatively quickly, followed by normal chemical evolution. This scenario naturally predicts a bimodality in the ages of solar twins, yielding both young (formed within the last few gigayears) and old populations. However, model calculations suggest that the old twins should be as old as ∼10 Gyr and fewer in number than what is observed (e.g., Palicio et al. 2023).
4. Orbital evolution
The arguments presented in Sect. 3 are framed within the context of radial migration theory, in which older solar twins are interpreted as having migrated from inner regions closer to the Galactic center, under the assumption that their orbits have been altered primarily through a dynamically cold process: so-called “churning”. To test this hypothesis, we examined the orbital property of solar twins as a function of age. Figure 2 presents a histogram, divided into age bins, of the guiding radii (Rg). No distinct differences are found among the age-tagged distributions, except for a slightly broader distribution for older twins, which is within the expected range for the churning process. A similar feature is also seen in the distributions of eccentricities, e, and maximum vertical distances from the disk, Zmax, as shown in Fig. D.2. We therefore conclude that the orbital evolution of solar twins has been governed primarily by diffusion in angular momentum rather than by radial heating (“blurring”), as assumed. If the blurring process dominated instead, the peaks in the Rg distributions for older twins would shift to smaller values than 8 kpc, reflecting their inner birth radii.
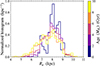 |
Fig. 2. Normalized histograms of the guiding radii, Rg, for solar twins, color-coded by their ages determined with MKs. Histograms for other orbital parameters are shown in Fig. D.2. |
5. Conclusions
From our catalog of 6594 local solar twins, whose ages were carefully determined in our separate paper (Paper I), we derived their age distribution. This provides synchronized information on both the star formation history of the disk within the solar radius and the radial migration of the corresponding stars. We find a bimodal feature, with a prominent peak around ∼2 Gyr ago and a broad bump extending over ∼4 − 6 Gyr ago. The former is consistent with previous studies suggesting that a burst of star formation was triggered relatively recently in the Galactic disk encompassing the solar neighborhood. Our result strengthens the argument that interactions with the Sgr dwarf galaxy during pericentric passages may have induced bursts of star formation in the disk.
In contrast, the latter may indicate the important role of the Galactic bar, which can enhance both star formation and the efficiency of radial migration during its formation epoch. This interpretation points to a relatively young age for the bar, estimated to be ∼4 − 7 Gyr, corresponding to a period of heightened activity within the forming bar. This phase of strong bar activity likely overlapped with the formation of the Solar System in the inner disk. In this context, the Sun would have naturally migrated as one member of a large group of co-migrating stars.
References
- Athanassoula, E. 1992, MNRAS, 259, 328 [NASA ADS] [CrossRef] [Google Scholar]
- Baba, J. 2025, PASJ, 77, 916 [Google Scholar]
- Baba, J., Saitoh, T. R., & Tsujimoto, T. 2023, MNRAS, 526, 6088 [Google Scholar]
- Baba, J., Tsujimoto, T., & Saitoh, T. R. 2024, ApJ, 976, L29 [Google Scholar]
- Bedell, M., Bean, J. L., Meléndez, J., et al. 2018, ApJ, 865, 68 [Google Scholar]
- Bellazzini, M., Massari, D., Ceccarelli, E., et al. 2024, A&A, 683, A136 [NASA ADS] [CrossRef] [EDP Sciences] [Google Scholar]
- Belokurov, V., & Kravtsov, A. 2022, MNRAS, 514, 689 [NASA ADS] [CrossRef] [Google Scholar]
- Belokurov, V., Erkal, D., Evans, N. W., Koposov, S. E., & Deason, A. J. 2018, MNRAS, 478, 611 [Google Scholar]
- Binney, J., & Tremaine, S. 2008, Galactic Dynamics, 2nd edn. (Princeton: Princeton Univ. Press) [Google Scholar]
- Bland-Hawthorn, J., & Gerhard, O. 2016, ARA&A, 54, 529 [Google Scholar]
- Bovy, J., Leung, H. W., Hunt, J. A. S., et al. 2019, MNRAS, 490, 4740 [Google Scholar]
- Bressan, A., Marigo, P., Girardi, L., et al. 2012, MNRAS, 427, 127 [NASA ADS] [CrossRef] [Google Scholar]
- Ceverino, D., & Klypin, A. 2007, MNRAS, 379, 1155 [NASA ADS] [CrossRef] [Google Scholar]
- Chen, T., & Prantzos, N. 2025, A&A, 694, A120 [NASA ADS] [CrossRef] [EDP Sciences] [Google Scholar]
- Chen, Y., Bressan, A., Girardi, L., et al. 2015, MNRAS, 452, 1068 [Google Scholar]
- Chiappini, C., Matteucci, F., & Romano, D. 2001, ApJ, 554, 1044 [NASA ADS] [CrossRef] [Google Scholar]
- Chiba, R., Friske, J. K. S., & Schönrich, R. 2021, MNRAS, 500, 4710 [Google Scholar]
- Dehnen, W. 2000, AJ, 119, 800 [NASA ADS] [CrossRef] [Google Scholar]
- del Alcázar-Julià, M., Figueras, F., Robin, A. C., Bienaymé, O., & Anders, F. 2025, A&A, 697, A128 [Google Scholar]
- Di Matteo, P., Haywood, M., Combes, F., Semelin, B., & Snaith, O. N. 2013, A&A, 553, A102 [NASA ADS] [CrossRef] [EDP Sciences] [Google Scholar]
- Dillamore, A. M., & Sanders, J. L. 2025, MNRAS, 542, 1331 [Google Scholar]
- Fragkoudi, F., Katz, D., Trick, W., et al. 2019, MNRAS, 488, 3324 [NASA ADS] [Google Scholar]
- Friedli, D., & Benz, W. 1995, A&A, 301, 649 [NASA ADS] [Google Scholar]
- Gaia Collaboration (Babusiaux, C., et al.) 2018, A&A, 616, A10 [NASA ADS] [CrossRef] [EDP Sciences] [Google Scholar]
- Gallart, C., Zoccali, M., & Aparicio, A. 2005, ARA&A, 43, 387 [Google Scholar]
- Gallart, C., Surot, F., Cassisi, S., et al. 2024, A&A, 687, A168 [NASA ADS] [CrossRef] [EDP Sciences] [Google Scholar]
- Hayden, M. R., Bovy, J., Holtzman, J. A., et al. 2015, ApJ, 808, 132 [Google Scholar]
- Helmi, A., Babusiaux, C., Koppelman, H. H., et al. 2018, Nature, 563, 85 [Google Scholar]
- Hunt, J. A. S., & Bovy, J. 2018, MNRAS, 477, 3945 [NASA ADS] [CrossRef] [Google Scholar]
- Hunt, J. A. S., Bovy, J., Pérez-Villegas, A., et al. 2018, MNRAS, 474, 95 [NASA ADS] [CrossRef] [Google Scholar]
- Khoperskov, S., Di Matteo, P., Haywood, M., Gómez, A., & Snaith, O. N. 2020, A&A, 638, A144 [NASA ADS] [CrossRef] [EDP Sciences] [Google Scholar]
- Kroupa, P. 2001, MNRAS, 322, 231 [NASA ADS] [CrossRef] [Google Scholar]
- Li, C., Yuan, Z., Monari, G., et al. 2024, A&A, 690, A26 [NASA ADS] [CrossRef] [EDP Sciences] [Google Scholar]
- Lu, Y. L., Minchev, I., Buck, T., et al. 2024, MNRAS, 535, 392 [NASA ADS] [CrossRef] [Google Scholar]
- Lucy, L. B. 1974, AJ, 79, 745 [Google Scholar]
- Matsunaga, N., Itane, A., Hattori, K., et al. 2022, ApJ, 925, 10 [CrossRef] [Google Scholar]
- Minchev, I., & Famaey, B. 2010, ApJ, 722, 112 [Google Scholar]
- Mor, R., Robin, A. C., Figueras, F., Roca-Fàbrega, S., & Luri, X. 2019, A&A, 624, L1 [NASA ADS] [CrossRef] [EDP Sciences] [Google Scholar]
- Nepal, S., Chiappini, C., Guiglion, G., et al. 2024, A&A, 681, L8 [NASA ADS] [CrossRef] [EDP Sciences] [Google Scholar]
- Palicio, P. A., Martinez-Valpuesta, I., Allende Prieto, C., et al. 2018, MNRAS, 478, 1231 [NASA ADS] [CrossRef] [Google Scholar]
- Palicio, P. A., Spitoni, E., Recio-Blanco, A., et al. 2023, A&A, 678, A61 [NASA ADS] [CrossRef] [EDP Sciences] [Google Scholar]
- Plotnikova, A., Spina, L., Ratcliffe, B., Casali, G., & Carraro, G. 2024, A&A, 691, A298 [NASA ADS] [CrossRef] [EDP Sciences] [Google Scholar]
- Portail, M., Gerhard, O., Wegg, C., & Ness, M. 2017, MNRAS, 465, 1621 [NASA ADS] [CrossRef] [Google Scholar]
- Prantzos, N., Abia, C., Chen, T., et al. 2023, MNRAS, 523, 2126 [NASA ADS] [CrossRef] [Google Scholar]
- Quillen, A. C. 2003, AJ, 125, 785 [NASA ADS] [CrossRef] [Google Scholar]
- Ratcliffe, B., Minchev, I., Anders, F., et al. 2023, MNRAS, 525, 2208 [NASA ADS] [CrossRef] [Google Scholar]
- Recio-Blanco, A., de Laverny, P., Palicio, P. A., et al. 2023, A&A, 674, A29 [NASA ADS] [CrossRef] [EDP Sciences] [Google Scholar]
- Richardson, W. H. 1972, J. Opt. Soc. Am. (1917-1983), 62, 55 [CrossRef] [Google Scholar]
- Rocha-Pinto, H. J., Scalo, J., Maciel, W. J., & Flynn, C. 2000, A&A, 358, 869 [NASA ADS] [Google Scholar]
- Roškar, R., Debattista, V. P., Quinn, T. R., Stinson, G. S., & Wadsley, J. 2008, ApJ, 684, L79 [Google Scholar]
- Ruiz-Lara, T., Gallart, C., Bernard, E. J., & Cassisi, S. 2020, Nat. Astron., 4, 965 [NASA ADS] [CrossRef] [Google Scholar]
- Ruiz-Lara, T., Mirabal, D., Gallart, C., et al. 2026, A&A, 705, A92 [NASA ADS] [CrossRef] [EDP Sciences] [Google Scholar]
- Sahlholdt, C. L., Feltzing, S., & Feuillet, D. K. 2022, MNRAS, 510, 4669 [NASA ADS] [CrossRef] [Google Scholar]
- Sanders, J. L., Smith, L., & Evans, N. W. 2019, MNRAS, 488, 4552 [NASA ADS] [CrossRef] [Google Scholar]
- Schönrich, R., & Binney, J. 2009, MNRAS, 396, 203 [Google Scholar]
- Sellwood, J. A., & Binney, J. J. 2002, MNRAS, 336, 785 [Google Scholar]
- Sestito, F., Martin, N. F., Starkenburg, E., et al. 2020, MNRAS, 497, L7 [Google Scholar]
- Sestito, F., Buck, T., Starkenburg, E., et al. 2021, MNRAS, 500, 3750 [Google Scholar]
- Taniguchi, D., de Laverny, P., Recio-Blanco, A., Tsujimoto, T., & Palicio, P. A. 2026, A&A, 707, A260 [NASA ADS] [CrossRef] [EDP Sciences] [Google Scholar]
- Tsujimoto, T. 2021, ApJ, 920, L32 [Google Scholar]
- Tsujimoto, T., & Baba, J. 2020, ApJ, 904, 137 [Google Scholar]
- Wylie, S. M., Clarke, J. P., & Gerhard, O. E. 2022, A&A, 659, A80 [NASA ADS] [CrossRef] [EDP Sciences] [Google Scholar]
- Xiang, M., & Rix, H.-W. 2022, Nature, 603, 599 [NASA ADS] [CrossRef] [Google Scholar]
- Zhang, H., Belokurov, V., Evans, N. W., et al. 2025, ApJ, 983, L10 [Google Scholar]
In this Letter, we present results based on the ages inferred from MKs, since this quantity is only minimally affected by selection effects. The results based on the ages from log g and MG are provided in Appendix D for reference.
In Gallart et al. (2024), the age distribution is presented as a function of stellar metallicity. According to their results, the bump around 4 − 6 Gyr is composed mainly of stars with metallicities lower than the solar value, contrary to our solar twin sample.
Appendix A: Acknowledgements
The authors gratefully acknowledge the anonymous referee for providing the comments that improved our work. TT and DT thank J. Baba for fruitful discussions on Galactic dynamics. This work has been supported by the Tokyo Center For Excellence Project, Tokyo Metropolitan University. TT acknowledges the support by JSPS KAKENHI Grant Nos. 22K18280 and 23H00132. DT acknowledges financial support from JSPS Research Fellowship for Young Scientists and accompanying Grants-in-Aid for JSPS Fellows (23KJ2149). PdL and ARB acknowledge partial funding from the European Union’s Horizon 2020 research and innovation program under SPACE-H2020 grant agreement number 101004214 (EXPLORE project).
This work has made use of data from the European Space Agency (ESA) mission Gaia (https://www.cosmos.esa.int/gaia), processed by the Gaia Data Processing and Analysis Consortium (DPAC, https://www.cosmos.esa.int/web/gaia/dpac/consortium). Funding for the DPAC has been provided by national institutions, in particular the institutions participating in the Gaia Multilateral Agreement.
Appendix B: Deconvolution of the age histogram
In this Appendix, we provide a detailed description of the deconvolution procedure outlined in Sect. 2 to derive the “intrinsic” age distribution of migrated stars. For this purpose, just showing the histogram of solar twin ages (blue histogram in Fig. B.1) is insufficient, given that the solar twin selection effects alter the histogram (see Sect. 4.3.2 in Paper I). Such effects should be corrected for, or at minimum accounted for, when analyzing datasets from larger surveys (Bland-Hawthorn & Gerhard 2016).
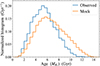 |
Fig. B.1. Observed histogram of solar twin ages. Histograms shows the ages of stars with the relative age error smaller than 50%, determined using MKs for the observed (blue) and mock (orange) samples. See Fig. D.3 for results using log g and those using MG. |
To characterize the observational selection effects of our solar twin catalog, Paper I constructed a mock solar twin sample. Stellar ages and initial metallicities were randomly sampled from uniform distributions, and initial masses were sampled from the Kroupa (2001) initial mass function. Synthetic stellar parameters and photometric quantities were then generated using the PARSEC isochrones. Simulated observational uncertainties and the same selection criteria as for the real sample were applied, thereby embedding the expected selection effects for the observed solar twins catalog in the mock catalog (see Sect. 4.3.1 in Paper I for more details).
The selection effects in our solar twin sample are illustrated in the orange histogram in Fig. B.1, which shows the age histogram of mock solar twins assuming a flat intrinsic age distribution. The figure illustrates, for example, that most solar-type stars older than ∼10 Gyr have already evolved off the main sequence and therefore no longer satisfy the solar twin criteria (i.e., Teff, log g, and [M/H] are around the solar values). Consequently, even though the intrinsic age distribution is flat, the mock solar twin histogram contains very few stars at such old ages.
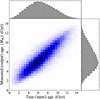 |
Fig. B.2. Selection function for solar twin ages determined with MKs. 2D histogram in the central panel shows the distribution of the input true and output estimated ages for the mock solar twins. Top and right panels show the normalized marginal histograms for the input and output ages, respectively. See Fig. D.4 for results using log g and those using MG. |
Here, we describe how we corrected for the selection effects from the observed solar twin age histogram. The 2D histogram in Fig. B.2 shows the selection function matrix S for our solar twin ages determined with MKs. The matrix was constructed by binning the true (input) and inferred (output) ages of 75 588 mock stars generated by Paper I on a regular grid with 0.5 Gyr bins. We remind that the mock stars were initially drawn from a flat intrinsic age distribution before applying the solar twin selection criteria. By construction, only mock stars that satisfy the solar twin selection criteria are included in this 2D histogram. The matrix S is therefore not normalized by column or row.
With this definition of matrix S, any observed solar twin age histogram hobs is related to the corresponding intrinsic age histogram htrue through the selection function matrix S derived from the mock catalog:
 (B.1)
(B.1)
In the current analysis, we estimate htrue for the parent population that gave rise to the observed solar twins, by deconvolving the age distribution hobs of the solar twins actually observed. We employed two independent deconvolution approaches:
-
Regularized least-squares (RLS) inversion. In this approach, the residual between the observed histogram hobs and the recovered Shtrue was minimized under Tikhonov regularization with a discrete difference operator D and a regularization parameter λ to enforce the smoothness in htrue:
![Mathematical equation: $$ \begin{aligned} \min _{{\boldsymbol{h}}_{\rm {true}}\ge 0}\left[||{\boldsymbol{w}}\odot ({\boldsymbol{h}}_{\rm {obs}}-S{\boldsymbol{h}}_{\rm {true}})||_{2}^{2}+\lambda ||D{\boldsymbol{h}}_{\rm {true}}||_{2}^{2}\right], \end{aligned} $$](/articles/aa/full_html/2026/03/aa58914-26/aa58914-26-eq2.gif) (B.2)
(B.2)where the weight vector was defined as
 . The addition of the constant term prevents the weights from diverging in bins with very small hobs values at old ages.
 -
Richardson-Lucy (RL) iterative deconvolution (Richardson 1972; Lucy 1974). In this approach, hobs was iteratively updated according to
 (B.3)
(B.3)starting from a flat initial guess
 . The total iteration number N serves as a hyperparameter that implicitly regularizes the solution through early stopping.
Both methods were applied to the observed histogram hobs while varying the corresponding hyperparameters (λ for the RLS method and N for the RL method).
To see the behavior of both methods, Figs. B.3 and B.4 show the deconvolved intrinsic age distributions htrue obtained with the RLS and RL methods, respectively, for different hyperparameter values. In the RLS method, htrue remains relatively flat when λ is large (i.e., more weight on the smoothness), whereas small-scale, possibly artificial, structures emerge as λ decreases. A similar trend is also seen with the RL method, where increasing N (i.e., repeating the iterative update) produces a progressively bumpier htrue.
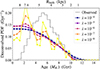 |
Fig. B.3. Dependence of the deconvolved MKs-based age PDF obtained with the RLS method on the hyperparameter λ. |
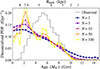 |
Fig. B.4. Dependence of the deconvolved MKs-based age PDF obtained with the RL method on the hyperparameter N. |
To choose the optimal hyperparameter value, we divided hobs into five contiguous blocks and performed leave-one-block-out cross validation. Across a grid of hyperparameter values, we chose the one minimizing the residual  in the validation set. For the MKs-based ages, the optimal values were λ = 10−5.8 for the RLS method and N = 16 for the RL method, which were used to produce Fig. 1. We chose λ = 10−6.5 and N = 20 for the log g-based ages, and λ = 10−6.1 and N = 20 for the MG-based ages in Fig. D.1.
Appendix C: Impact of finite-sample statistics
Our observed solar twin sample consists of a finite number of stars (6, 594 stars), and therefore any age distribution inferred from this sample is subject to statistical fluctuations. In the following, we use the normalized ratio between the observed and mock age histograms (blue line in Fig. 1) as a rough estimate for the intrinsic age distribution to examine the impact of finite-sample statistics. In the main text, statistical uncertainties in the deconvolved age PDFs (orange and green shaded regions in Fig. 1) are estimated using Monte Carlo (MC) realizations that assume Poisson statistics for the observed age histogram. In this Appendix, we validate whether this uncertainty estimate is consistent with the sampling variance expected from a finite-sized sample.
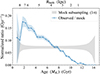 |
Fig. C.1. Finite-sample effects on the observed-to-mock age histogram ratio. Blue line shows the normalized ratio between the observed and mock age histograms for solar twins based on MKs, identical to that shown in Fig. 1. Blue shaded region indicates the statistical uncertainty on this ratio, estimated from 105 Monte Carlo realizations assuming Poisson statistics for the observed age histogram. Gray shaded region represents the 1σ sampling variance expected from finite-sample statistics, estimated by repeatedly drawing random subsamples from the mock catalog with the same number of stars as in the observed sample and computing the corresponding subsample-to-mock ratios. |
We performed an independent MC subsampling experiment using only the mock catalog, which contains approximately ten times more stars (75, 588 stars) than the observed sample. From the full mock catalog, we repeatedly chose random subsamples with the same number of stars as in the observed sample and computed the normalized ratio between each subsample and the full mock catalog, in the same way as for the observed data. After 104 realizations, the distribution of these ratios quantifies the sampling variance expected for the observed sample.
Gray shaded region in Fig. C.1 shows the 1σ sampling variance derived from the mock subsampling. The typical fractional 1σ width is 9% (gray region), which is comparable to the typical statistical uncertainty of 10% estimated from the MC realizations of the observed sample (blue region). This agreement indicates that our estimation of the statistical uncertainty in the deconvolved intrinsic age distribution provides a reasonable approximation to the sampling variance arising from finite-sample statistics. However, it should be noted that the presence of the bump around 4 − 6 Gyr ago may become marginal when these statistical uncertainties are taken into account, especially given that the RLS method does not detect such a bump feature. Nonetheless, we emphasize that Solar twins with ages comparable to that of the Sun do not constitute a negligible population in the solar neighborhood.
Appendix D: Additional figures
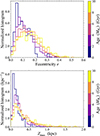 |
Fig. D.2. The same as Fig. 2 but for the eccentricity e (left) and the maximum vertical distance from the Galactic plane Zmax (right). |
All Figures
|
Fig. 1. (Deconvolved) probability density function (PDF) of the ages of solar twins determined with MKs. The dotted black line shows the normalized age histogram of our solar twin catalog (same as the blue histogram in Fig. B.1). The blue line shows the normalized ratio between the observed and mock age histograms, as a rough estimate of the intrinsic age distribution. Orange and green lines represent the deconvolved, intrinsic age distributions obtained using the two different (RLS and RL) methods. Shaded regions indicate the statistical uncertainty in the deconvolved PDFs, estimated from 104 Monte Carlo realizations assuming Poisson statistics for the original age histogram (see Appendix C for a validation of this uncertainty estimate). The upper axis provides reference Rbirth values, based on the [Fe/H] = 0 dex slice of the age–Rbirth–[Fe/H] relation in Ratcliffe et al. (2023). See Fig. D.1 for results using log g and those using MG. |
| In the text | |
|
Fig. 2. Normalized histograms of the guiding radii, Rg, for solar twins, color-coded by their ages determined with MKs. Histograms for other orbital parameters are shown in Fig. D.2. |
| In the text | |
|
Fig. B.1. Observed histogram of solar twin ages. Histograms shows the ages of stars with the relative age error smaller than 50%, determined using MKs for the observed (blue) and mock (orange) samples. See Fig. D.3 for results using log g and those using MG. |
| In the text | |
|
Fig. B.2. Selection function for solar twin ages determined with MKs. 2D histogram in the central panel shows the distribution of the input true and output estimated ages for the mock solar twins. Top and right panels show the normalized marginal histograms for the input and output ages, respectively. See Fig. D.4 for results using log g and those using MG. |
| In the text | |
|
Fig. B.3. Dependence of the deconvolved MKs-based age PDF obtained with the RLS method on the hyperparameter λ. |
| In the text | |
|
Fig. B.4. Dependence of the deconvolved MKs-based age PDF obtained with the RL method on the hyperparameter N. |
| In the text | |
|
Fig. C.1. Finite-sample effects on the observed-to-mock age histogram ratio. Blue line shows the normalized ratio between the observed and mock age histograms for solar twins based on MKs, identical to that shown in Fig. 1. Blue shaded region indicates the statistical uncertainty on this ratio, estimated from 105 Monte Carlo realizations assuming Poisson statistics for the observed age histogram. Gray shaded region represents the 1σ sampling variance expected from finite-sample statistics, estimated by repeatedly drawing random subsamples from the mock catalog with the same number of stars as in the observed sample and computing the corresponding subsample-to-mock ratios. |
| In the text | |
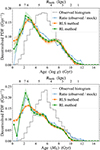 |
Fig. D.1. The same as Fig. 1 but for the age determined with log g (top) and MG (bottom). |
| In the text | |
|
Fig. D.2. The same as Fig. 2 but for the eccentricity e (left) and the maximum vertical distance from the Galactic plane Zmax (right). |
| In the text | |
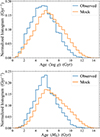 |
Fig. D.3. The same as Fig. B.1 but for the age determined with log g (top) and MG (bottom). |
| In the text | |
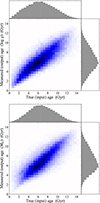 |
Fig. D.4. The same as Fig. B.2 but for the age determined with log g (top) and MG (bottom). |
| In the text | |
Current usage metrics show cumulative count of Article Views (full-text article views including HTML views, PDF and ePub downloads, according to the available data) and Abstracts Views on Vision4Press platform.
Data correspond to usage on the plateform after 2015. The current usage metrics is available 48-96 hours after online publication and is updated daily on week days.
Initial download of the metrics may take a while.