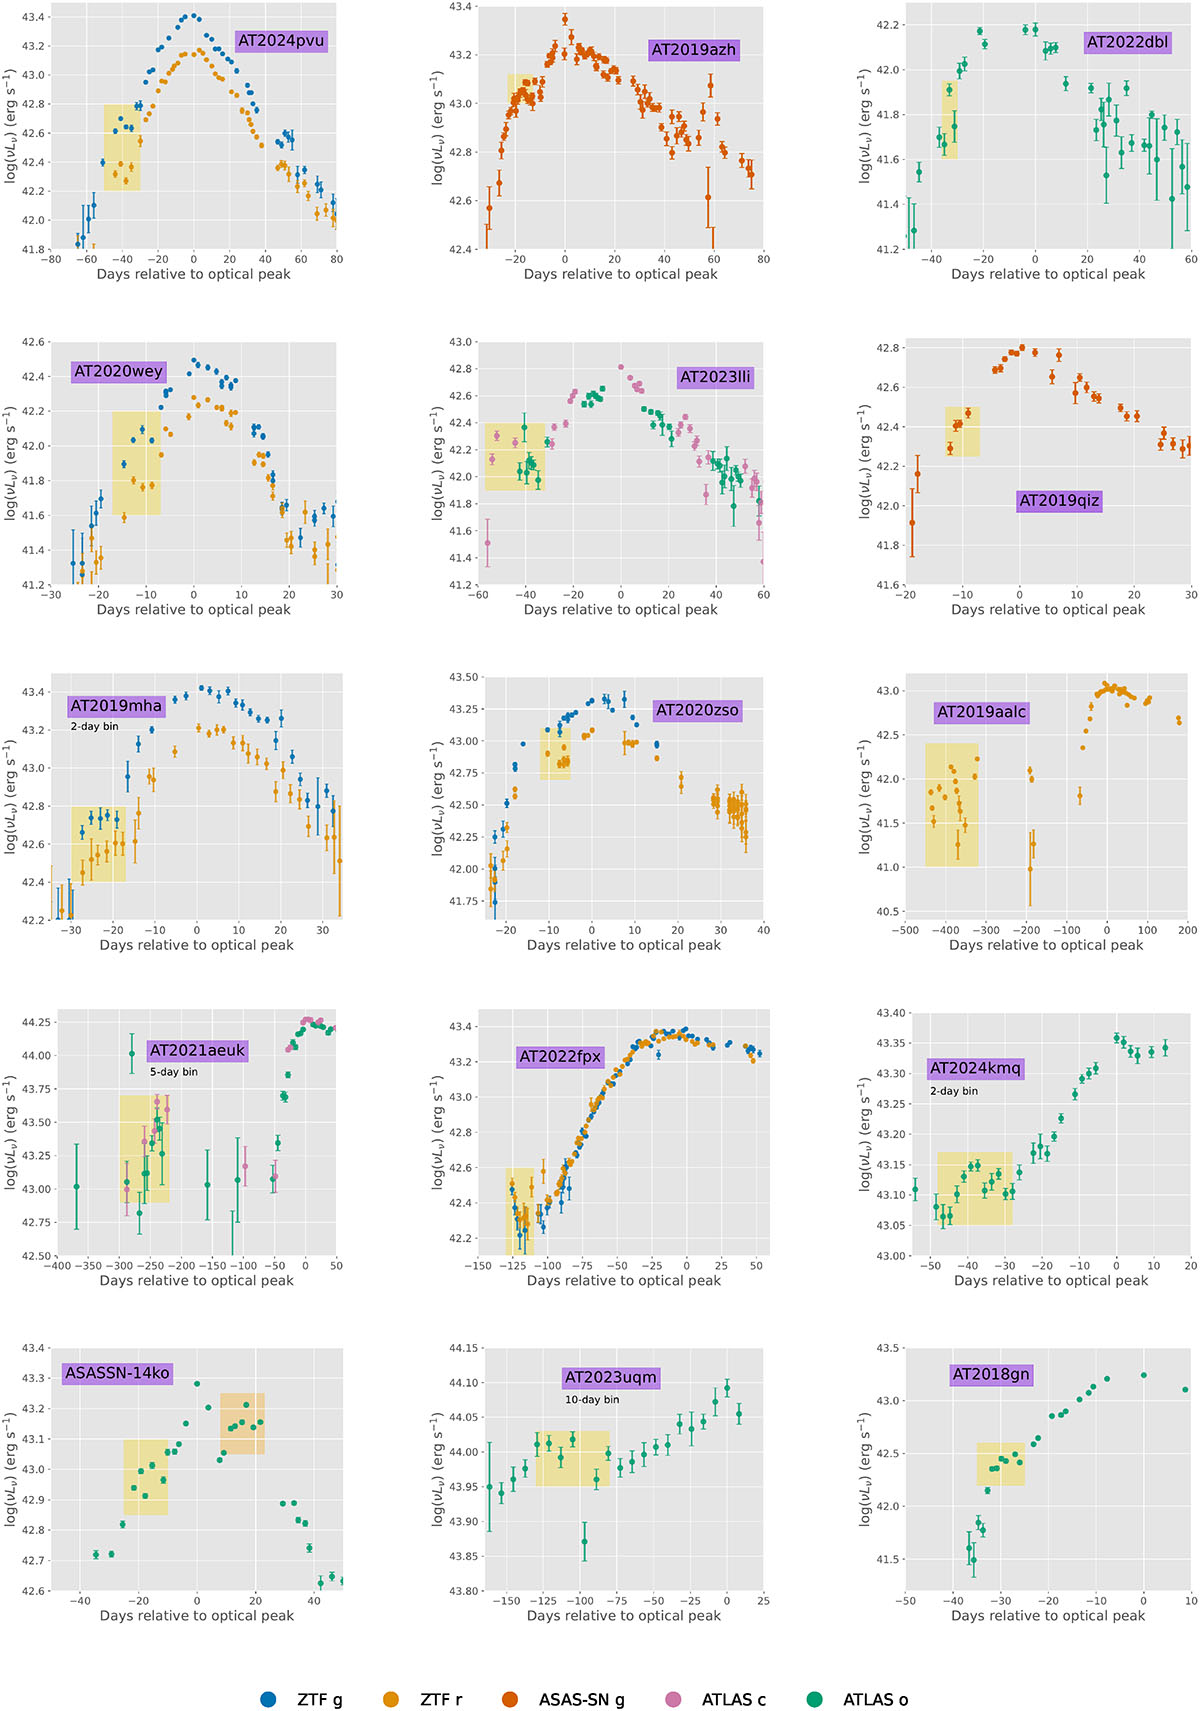
Fig. B.1.
Download original image
Optical light curves of our precursor sample. We show the differential (i.e., host-subtracted) light curves, with the only exception of AT2023uqm, whose precursor flare mainly exhibits negative fluxes (i.e., fainter than the baseline emission); in this case, we show the aperture photometry. The precursor features are highlighted (yellow shaded areas). ASASSN-14ko, in which case the re-brightening during decline was studied earlier in detail, is also highlighted (orange shaded area). Days are always in rest frame. The light curves were binned only for intranight observations to improve the signal-to-noise ratio, unless stated otherwise in the figure annotations.
Current usage metrics show cumulative count of Article Views (full-text article views including HTML views, PDF and ePub downloads, according to the available data) and Abstracts Views on Vision4Press platform.
Data correspond to usage on the plateform after 2015. The current usage metrics is available 48-96 hours after online publication and is updated daily on week days.
Initial download of the metrics may take a while.