| Issue |
A&A
Volume 707, March 2026
|
|
|---|---|---|
| Article Number | L19 | |
| Number of page(s) | 8 | |
| Section | Letters to the Editor | |
| DOI | https://doi.org/10.1051/0004-6361/202658951 | |
| Published online | 20 March 2026 | |
Letter to the Editor
Precursors in tidal disruption events: Repeating, fast, and active galactic nucleus-hosted TDEs
Ruhr University Bochum, Faculty of Physics and Astronomy, Astronomical Institute (AIRUB), Universitätsstraße 150, 44801 Bochum, Germany
★ Corresponding author: This email address is being protected from spambots. You need JavaScript enabled to view it.
Received:
14
January
2026
Accepted:
16
February
2026
Abstract
Context. Tidal disruption events (TDEs) are rare transients that provide important insights into the physics of galactic nuclei. A recently identified feature in their optical light curves is the presence of early bump-like structures (precursors) that appear before the onset of the main flare or during its rise.
Aims. Our aim was to build and study the first sample of precursor TDEs in order to improve our understanding of these features, which could be key to revealing the origin of the optical emission in TDEs.
Methods. We compiled all known precursor TDEs from the literature, searched for additional candidates, and analyzed them as a sample.
Results. We find that precursor TDEs predominantly fall within the subclasses of repeating TDEs, fast TDEs, and TDEs in active galactic nuclei (AGNs). We reveal a positive correlation between the occurrence time of the precursors relative to the main peak and the central black hole mass.
Conclusions. We suggest that the precursors appear due to interactions between the incoming stellar debris and the disk or leftover material from an earlier disruption (repeating and fast TDEs) or a stable pre-existing disk (TDEs in AGNs). Precursors are therefore potentially key signatures of repeating partial TDEs in previously quiescent galaxies.
Key words: accretion / accretion disks / black hole physics / galaxies: active / galaxies: nuclei / galaxies: Seyfert
© The Authors 2026
 Open Access article, published by EDP Sciences, under the terms of the Creative Commons Attribution License (https://creativecommons.org/licenses/by/4.0), which permits unrestricted use, distribution, and reproduction in any medium, provided the original work is properly cited.
This article is published in open access under the Subscribe to Open model. This email address is being protected from spambots. You need JavaScript enabled to view it. to support open access publication.
1. Introduction
Tidal disruption events (TDEs) are rare transients that occur when a star passes too close to a supermassive black hole (SMBH); the resulting tidal forces tear the star apart (Rees 1988). About half of the star’s material is accreted onto the black hole, generating a luminous outburst that can range from radio to X-ray wavelengths. TDEs are primarily identified through optical surveys (e.g., the Zwicky Transient Facility, ZTF; Bellm et al. 2019) and X-ray instruments (e.g., eROSITA; Predehl et al. 2021). The vast majority of these events exhibit one optical flare. However, this contrasts with theoretical predictions that partial disruptions, in which a bound stellar core survives and may produce recurrent flares, should occur frequently (Bortolas et al. 2023). Repeating partial tidal disruption events (pTDEs) can be envisioned as a natural outcome of the Hills capture mechanism (Hills 1988), in which a binary star is disrupted by a SMBH, capturing one component on a highly eccentric orbit susceptible to repeated partial disruptions. At each pericenter passage, the star loses a fraction of its mass to the SMBH, producing episodic stripping and recurrent flares on month-to-year timescales. To date, only a handful of pTDE candidates have been discovered: AT2020vdq (Somalwar et al. 2026), ASASSN−14ko (Payne et al. 2021; Tucker et al. 2021; Payne et al. 2022; Huang et al. 2023, 2025), eRASSt J045650.3−203750 (Liu et al. 2023, 2024), RX J133157.6-324319.7 (Hampel et al. 2022), AT2018fyk (Wevers et al. 2019, 2023; Wen et al. 2024; Pasham et al. 2024), AT2019avd (Malyali et al. 2021; Frederick et al. 2021; Chen et al. 2022; Wang et al. 2023, 2024a), AT2019azh (Hinkle et al. 2021), AT2022dbl (Lin et al. 2024; Hinkle et al. 2024; Makrygianni et al. 2025), AT2021aeuk (Sun et al. 2025), AT2022agi (in ULIRG F01004-2237) (Tadhunter et al. 2017; Sun et al. 2024), AT2019aalc (Veres et al. 2026; Śniegowska et al. 2025), and AT2023uqm (Wang et al. 2025).
The vast majority of TDEs were discovered in previously dormant galaxies. However, TDEs are expected to occur at comparable or even higher rates in active galactic nuclei (AGNs) (Merloni et al. 2015; Chan et al. 2019; McKernan et al. 2022; Ryu et al. 2024). Although the number of observationally confirmed TDEs occurring in AGNs (TDE-AGNs) remains smaller than expected, likely due to strong selection effects and the difficulty of distinguishing them from intrinsic AGN variability, as discussed by Merloni et al. (2015). Identified promising candidates include PS16dtm (Blanchard et al. 2017; Petrushevska et al. 2023), AT2021aeuk (Sun et al. 2025), AT2024kmq (Ho et al. 2025), AT2022agi (Tadhunter et al. 2017; Sun et al. 2024), and AT2019aalc (Śniegowska et al. 2025; Veres et al. 2026). A recently identified class of spectroscopically unique flares from flaring SMBHs – referred to as Bowen Fluorescence1 Flares (BFFs, Trakhtenbrot et al. 2019) – may represent TDEs occurring in AGNs (Milán Veres 2025; Veres et al. 2026). However, it is possible that the sudden change in accretion rate observed in BFFs may instead be explained by accretion disk instabilities (Śniegowska et al. 2025), while the presence of BF lines could be linked to a newly launched outflow driven by this rapid increase in accretion rate (Trakhtenbrot et al. 2019).
The origin of the optical and UV emission in TDEs is unclear. The leading explanations include the reprocessing of X-ray photons and shocks within the stellar debris streams. TDEs are characterized by a rapidly rising, nearly colorless optical flare that subsequently decays approximately as t−5/3, following the fallback rate of the disrupted debris. According to Coughlin & Nixon (2019), the fallback rate from a pTDE is generally expected to be approximately t−9/4 and effectively independent of the mass of the core that survives the encounter. However, three-dimensional hydrodynamic simulations predict a broader range of decline rates, spanning approximately t−p with p ≃ 2 − 5, depending on the stellar structure (and hence mass) and the impact parameter (Ryu et al. 2020). TDE flares typically show a smooth rise and decline. Only a small number of TDEs have been observed to exhibit early bump-like features in their optical light curves, occurring either prior to the onset of the main flare or during its rise; for simplicity, we refer to them in the following as precursors. Possible scenarios listed by Wang et al. (2024b) in order to explain the precursor features are (i) radiation from electron recombination and cooling in unbound debris, (ii) stream-stream collision, (iii) wind-stream collision, (iv) vertical shock compression during the first passage, and (v) shock breakout of the debris collision. Recently, Huang et al. (2025) and Zhang et al. (2025) came to the conclusion that the precursors detected in the TDE-AGNs ASASSN-14ko and AT2021aeuk, respectively, are the consequences of stellar stream–disk interactions. In this Letter we study the precursors in all known cases as a sample for the first time in order to better understand their origin. Throughout the paper, we adopt a flat ΛCDM cosmological model with parameters H0 = 70 km s−1 Mpc−1, ΩΛ = 0.73, and Ωm = 0.27 (Wright 2006).
2. The precursor sample
We collected all known regular TDEs and TDE-AGNs with reported precursor features in their optical light curves from the literature. We found 13 cases in total, including six regular TDEs, five TDE-AGNs, and two periodically repeating nuclear transients likely associated with pTDEs. Additionally, after a visual inspection of the publicly available optical photometric data, we identified the regular TDEs AT2024pvu and AT2022dbl, as well as the TDE-AGN candidate AT2019aalc, as exhibiting comparable signatures. The precursor sample, including the TDE subclass, the precursor occurrence times, and their durations, are presented in Appendix A.1. We requested optical differential light curves of all 16 transients using the Forced-Photometry Services of the ZTF2, the Asteroid Terrestrial-impact Last Alert System (ATLAS)3, and the All-Sky Automated Survey for Supernovae (ASAS-SN)4, and followed the recommendations outlined in the corresponding documentations of these services. We corrected for extinction by adopting the galactic extinction (Schlafly & Finkbeiner 2011). The light curves around the precursor features are shown in Appendix B.1. We find that every precursor TDE falls into one of three categories: repeating TDEs, fast TDEs, and TDE-AGNs. We note that some sources fall within multiple categories: AT2019aalc, AT2021aeuk, and ASASSN-14ko are candidate repeating TDE-AGNs, whilst the fast TDE AT2020zso occurred in a low-luminosity AGN and possibly AT2019qiz as well. In the following we refer to these with their conventional association.
2.1. Repeating TDEs
Interestingly, five TDEs from our precursor sample exhibit multiple optical flares. In three cases, shown in Appendix C, the optical light curves are characterized by two distinct flares, and the precursor feature were detected before the second flare. The first optical flares of AT2019azh and AT2024pvu were detected by the Catalina Real-time Transient Survey (CRTS). However, because of the survey’s low cadence or the absence of observations closely preceding the first flares, it is not possible to determine whether a precursor event occurred before them. The repeating nature of AT2019azh was studied by Hinkle et al. (2021) who revealed the first flare was detected in 2005. The precursor of the second optical flare was reported by Huang et al. (2024), but the feature was also noted by van Velzen et al. (2019) and Liu et al. (2022) who referred to it as a ≈15-day slowly rising or plateau phase of the optical light curve. The precursor appears in the bolometric light curve as well (see Appendix B in Hammerstein et al. 2023). Its optical emission declines very fast, similarly to AT2020wey discussed below. AT2022dbl is the most well-studied pTDE to date (see: Lin et al. 2024; Hinkle et al. 2024; Makrygianni et al. 2025). The precursor feature is visible only prior to the second flare. The discovery and classification of AT2024pvu were reported in Stein et al. (2024). The optical light curve was published by Jordana-Mitjans et al. (2025) who studied the polarization features of the TDE, whose properties are comparable to those of other regular TDEs. We found that a flaring episode of AT2024pvu was detected in 2006. ASASSN-14ko and AT2023uqm have numerous optical flares. Early bumps and re-brightenings were detected prior to and after the flares of ASASSN-14ko (Huang et al. 2025). Wang et al. (2025) find evidence of enhanced pre-flare emission prior to the first flare of AT2023uqm. Similar precursor features can be seen prior to later flares as well, most clearly before the second flare that we plot in Appendix B.1.
2.2. Fast TDEs
Five TDEs that were detected with only a single flare also exhibit an early bump in their optical light curves. Interestingly, these are primarily known as fast TDEs, i.e., a subclass of TDEs exhibiting fast-declining optical emission, following the classification by Charalampopoulos et al. (2023). AT2020wey is the first discovered fast TDE (Charalampopoulos et al. 2023). The decline rate within the first 20 days after peak was faster than for any previously measured TDEs. The power-law fit for the decay of the bolometric light curve resulted in a power-law index of p = −2.84 ± 0.18. AT2019qiz shares several properties with AT2020wey (Charalampopoulos et al. 2023). Its bolometric light curve decays with p = −2.51 ± 0.03 (Charalampopoulos et al. 2023). AT2023lli was classified as a fast TDE by Huang et al. (2024) and its bolometric light curve decays with p ≈ −4.1 making it the fastest-declining TDE known to date (Huang et al. 2024) together with AT2019mha. In particular, AT2019mha’s decline was similarly fast (p ≈ −4) (van Velzen et al. 2021). The light curve of AT2020zso shows a break during the rising phase 12 days before the peak, whereafter the slope of the rise significantly flattened (Wevers et al. 2022).
2.3. TDE-AGNs
We investigated the known TDE-AGN candidates and found that precursors prior to their primary optical flares were commonly detected. In the following, we describe the temporal behavior of the TDE-AGNs in our sample. AT2021aeuk was classified as a pTDE in a Seyfert-1 galaxy by Sun et al. (2025). The precursor peaked at L ∼ 4 × 1043 erg/s (in ATLAS c-band) which is the highest among the entire precursor sample. Due to the enhanced optical variability between the two flares, we cannot explicitly conclude whether a precursor was also present before the second flare. AT2019aalc is hosted by a Seyfert-1 galaxy as well and exhibited two distinct luminous optical flares. Veres et al. (2026) suggested a repeating pTDE-AGN scenario to explain the optical re-brightening and the spectroscopic features such as the variable BF and high-ionization coronal lines detected in this transient. Due to the quasi-periodic oscillations (QPOs) detected between the two main flares, we cannot conclude whether a precursor appeared before the second flare, similarly to AT2021aeuk. AT2024kmq was classified as a TDE-AGN by Ho et al. (2025) who also discusses its precursor. AT2019ahk occurred in a Seyfert galaxy showing weak AGN activity prior to the transient (Holoien et al. 2019). Its precursor was first noted by Wang et al. (2024b), but we note that it is only visible in the bolometric light curve published by Holoien et al. (2019). Therefore, we do not include this TDE in Appendix B.1. AT2022fpx was identified as a TDE, and its host is not unambiguously classified. While its infrared colors likely indicate the presence of an AGN, SED fitting implies no significant AGN contribution to the host light (Koljonen et al. 2024). The low-level but clearly detected infrared variability prior to the transient (Lin et al. 2025), however, confirms the presence of a low-luminosity AGN. AT2018gn is known as a TDE with precursor that occurred in a dusty environment, likely in an AGN (Wang et al. 2024b).
3. Discussion and conclusions
The nature of the precursors is yet unclear. Huang et al. (2025) stated that the early bumps and re-brightenings detected in the TDE-AGN ASASSN-14ko could potentially be explained by the energy dissipation from the plunging of the tidally stripped stream through an expanded accretion disk. In agreement with this scenario, the precursor of the TDE-AGN AT2021aeuk was explained with debris-disk interactions using hydrodynamical simulations by Zhang et al. (2025). We found that other TDE-AGNs also exhibit this feature. Notably, the QPOs detected in AT2019aalc were interpreted as the Lense–Thirring precession (Lense & Thirring 1918) of a misaligned disk hit by stellar debris in an inclined orbit (Jordana-Mitjans et al. 2025). This provides important evidence for the presence of stellar debris-disk interactions in this system. Because the innermost stable circular orbit (ISCO) scales linearly with BH mass (RISCO ∝ MBH, Bardeen et al. 1972), the radial extent of the inner accretion flow increases with MBH. As a result, the returning debris intersects the disk at larger radii and therefore at earlier relative times, potentially producing earlier or more pronounced precursor emission. We collected the black hole masses for our precursor sample from literature (listed in Appendix A.1). When available, we adopted black hole masses derived from reverberation mapping (Blandford & McKee 1982; Peterson et al. 2004); otherwise, we used estimates based on stellar velocity dispersion (Greene et al. 2020); when neither measurement was provided (i.e., not possible to derive from existing data), we relied on galaxy-mass scaling relations (Greene et al. 2020). For consistency, we recomputed the black hole masses for three instances (AT2022dbl, AT2023lli and AT2024kmq), those which previously relied on earlier scaling relations, using the relations of Greene et al. (2020) by adopting the velocity dispersion and total stellar mass estimates from the literature (Lin et al. 2024; Huang et al. 2024; Wang et al. 2024b; Ho et al. 2025). For AT2024pvu, we estimated the black hole mass using galaxy-mass scaling relation, for which we took the total stellar mass from the Blast5 transient’s host galaxy server. A log–log fit for the occurrence time versus the central black hole mass using orthogonal distance regression yields
The correlation between black hole mass and precursor occurrence time is moderate to strong. The Pearson correlation in log-space is 0.687 (p = 0.006655), while the Spearman rank correlation is 0.833 (p = 0.000217), indicating a statistically significant positive trend at the level of 3.7σ (see Fig. 1).
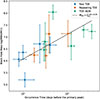 |
Fig. 1. Positive trend between the earlier occurrence time of the precursors and the mass of the central SMBH. We define the occurrence time as the time when the optical emission reached its highest value during the precursor flare; the x-axis uncertainties represent the duration of the precursor. The black hole mass estimates are explained in detail in the text. We excluded AT2022fpx from the fit due to lack of observations around the precursor. |
Every repeating TDE that we could investigate exhibits a precursor6. While AT2022dbl is a spectroscopically confirmed repeating pTDE, the cases of AT2019azh and AT2024pvu differ since no spectroscopic observations were performed during their first flares. This makes a pTDE scenario questionable; moreover, such long periods (> 10 years) require an extremely eccentric and therefore unstable orbit. One possible solution is the Hills mechanism, which can result in highly eccentric but stable orbits suitable for repeated partial disruptions. Sun et al. (2024) successfully accounted for the decade-separated recurring TDEs in ULIRG F01004–2237 through the Hills mechanism. Regardless of whether AT2019azh and AT2024pvu are truly pTDEs similar to AT2022dbl, or whether their double flares result from two individual TDEs, the precursors may be linked to the repeating-flare behavior of these events. We suggest that when the returning stellar stream strikes a pre-existing disk (or leftover debris), shocks dissipate a fraction of its kinetic energy, part of which is radiated to produce the observed precursor feature. This scenario is furthermore supported by the early radio detection of AT2019azh approximately ten days before the optical peak, which is the only radio detection of a thermal TDE at such early times (Goodwin et al. 2022). The early radio detection may be attributed to shocks produced by the interaction between the stellar debris and the fossil disk.
The scenario discussed above may explain why repeating TDEs were detected with precursors, while single TDEs typically do not display precursor features. We found only five single TDEs with precursors out of every known TDE. We note that these events rank among the most rapidly fading TDEs identified to date. In particular, AT2023lli and AT2019mha exhibit the fastest declines in their bolometric light curves, followed by AT2020wey and AT2019qiz. While AT2020zso is among the fastest TDEs in the sample of Hammerstein et al. (2023), apart from AT2020riz, only the four above-mentioned events exhibit comparable e-folding decay times. The five single-flare TDEs in our precursor sample exhibit decline rates significantly steeper than the canonical t−5/3 behavior, but in agreement with the expectations of Ryu et al. (2020) for pTDEs, i.e., a decay of the form t−p with p ≃ 2 − 5. These events may not represent full disruptions or even the initial flares, as typically assumed for newly discovered cases, but rather secondary flares resulting from partial disruptions. The stellar debris–fossil disk interaction scenario provides an explanation for the precursors detected in the fast TDE cases as well. This is in agreement with the similar properties observed between the precursors of repeating TDEs and those of fast TDEs, both in terms of their timing relative to the main peak and their duration.
To summarize, we suggest that TDE precursors appear due to interactions between the incoming stellar debris and the disk or leftover material from an earlier disruption (repeating TDEs) or a stable pre-existing disk (TDE-AGNs). Fast TDEs whose decline rates match those predicted in pTDE simulations may not represent full disruptions or even first flares, and their precursors can be interpreted in the same framework as in repeating TDEs. Importantly, based on the theoretically expected pTDE rates, Bortolas et al. (2023) proposed that many of the regular TDEs classified as total disruptions in the standard framework are in fact pTDEs. This is in agreement with our proposed explanation for the nature of fast TDEs. Early triggering of follow-up observations for newly discovered TDEs, including in the radio band, will be crucial in order to constrain the origin of precursors. Especially, the third flare of AT2022dbl is expected to occur in early 2026 and will be detectable according to the light curve simulations of Zhong (2025). Other repeating TDEs in our sample are likewise expected to undergo future flaring episodes (see Table 2 in Quintin et al. 2025).
Acknowledgments
I thank the anonymous referee for their constructive suggestions on the Letter. I thank the language editor for their corrections. I thank for Anna Franckowiak (RUB) for fruitful discussion and for commenting the manuscript. PMV acknowledges the support from the DFG via the Collaborative Research Center SFB1491 Cosmic Interacting Matters - From Source to Signal. I acknowledge using a color-blind friendly palette (Ichihara et al. 2008) in the plots.
References
- Bao, D.-W., Guo, W.-J., Zhang, Z.-X., et al. 2024, ApJ, 977, 279 [Google Scholar]
- Bardeen, J. M., Press, W. H., & Teukolsky, S. A. 1972, ApJ, 178, 347 [Google Scholar]
- Bellm, E. C., Kulkarni, S. R., Graham, M. J., et al. 2019, PASP, 131, 018002 [Google Scholar]
- Blanchard, P. K., Nicholl, M., Berger, E., et al. 2017, ApJ, 843, 106 [Google Scholar]
- Blandford, R. D., & McKee, C. F. 1982, ApJ, 255, 419 [Google Scholar]
- Bortolas, E., Ryu, T., Broggi, L., & Sesana, A. 2023, MNRAS, 524, 3026 [NASA ADS] [CrossRef] [Google Scholar]
- Bowen, I. S. 1934, PASP, 46, 146 [NASA ADS] [CrossRef] [Google Scholar]
- Bowen, I. S. 1935, ApJ, 81, 1 [NASA ADS] [CrossRef] [Google Scholar]
- Chan, C.-H., Piran, T., Krolik, J. H., & Saban, D. 2019, ApJ, 881, 113 [Google Scholar]
- Charalampopoulos, P., Pursiainen, M., Leloudas, G., et al. 2023, A&A, 673, A95 [NASA ADS] [CrossRef] [EDP Sciences] [Google Scholar]
- Chen, J.-H., Dou, L.-M., & Shen, R.-F. 2022, ApJ, 928, 63 [NASA ADS] [CrossRef] [Google Scholar]
- Coughlin, E. R., & Nixon, C. J. 2019, ApJ, 883, L17 [NASA ADS] [CrossRef] [Google Scholar]
- Faris, S., Arcavi, I., Makrygianni, L., et al. 2024, ApJ, 969, 104 [Google Scholar]
- Frederick, S., Gezari, S., Graham, M. J., et al. 2021, ApJ, 920, 56 [NASA ADS] [CrossRef] [Google Scholar]
- Goodwin, A. J., van Velzen, S., Miller-Jones, J. C. A., et al. 2022, MNRAS, 511, 5328 [NASA ADS] [CrossRef] [Google Scholar]
- Greene, J. E., Strader, J., & Ho, L. C. 2020, ARA&A, 58, 257 [Google Scholar]
- Hammerstein, E., van Velzen, S., Gezari, S., et al. 2023, ApJ, 942, 9 [NASA ADS] [CrossRef] [Google Scholar]
- Hampel, J., Komossa, S., Greiner, J., et al. 2022, RNAAS, 22, 055004 [Google Scholar]
- Hills, J. G. 1988, Nature, 331, 687 [Google Scholar]
- Hinkle, J. T., Holoien, T. W.-S., Auchettl, K., et al. 2021, MNRAS, 500, 1673 [Google Scholar]
- Hinkle, J. T., Auchettl, K., Hoogendam, W. B., et al. 2024, OJAp, submitted [arXiv:2412.15326] [Google Scholar]
- Ho, A. Y. Q., Yao, Y., Matsumoto, T., et al. 2025, ApJ, 989, 54 [Google Scholar]
- Holoien, T. W.-S., Vallely, P. J., Auchettl, K., et al. 2019, ApJ, 883, 111 [Google Scholar]
- Huang, S., Jiang, N., Shen, R.-F., Wang, T., & Sheng, Z. 2023, ApJ, 956, L46 [NASA ADS] [CrossRef] [Google Scholar]
- Huang, S., Jiang, N., Zhu, J., et al. 2024, ApJ, 964, L22 [NASA ADS] [CrossRef] [Google Scholar]
- Huang, S., Wang, T., Jiang, N., et al. 2025, ApJ, 988, 237 [Google Scholar]
- Ichihara, Y. G., Okabe, M., Iga, K., et al. 2008, SPIE Conf. Ser., 6807, 68070O [Google Scholar]
- Jordana-Mitjans, N., Franckowiak, A., Ramírez-Ruiz, E., et al. 2025, A&A, 704, A250 [NASA ADS] [CrossRef] [EDP Sciences] [Google Scholar]
- Koljonen, K. I. I., Liodakis, I., Lindfors, E., et al. 2024, MNRAS, 532, 112 [Google Scholar]
- Lense, J., & Thirring, H. 1918, Phys. Z., 19, 156 [Google Scholar]
- Lin, Z., Jiang, N., Wang, T., et al. 2024, ApJ, 971, L26 [NASA ADS] [CrossRef] [Google Scholar]
- Lin, Z., Jiang, N., Wang, Y., et al. 2025, ApJ, 990, 22 [Google Scholar]
- Liu, X.-L., Dou, L.-M., Chen, J.-H., & Shen, R.-F. 2022, ApJ, 925, 67 [NASA ADS] [CrossRef] [Google Scholar]
- Liu, Z., Malyali, A., Krumpe, M., et al. 2023, A&A, 669, A75 [NASA ADS] [CrossRef] [EDP Sciences] [Google Scholar]
- Liu, Z., Ryu, T., Goodwin, A. J., et al. 2024, A&A, 683, L13 [NASA ADS] [CrossRef] [EDP Sciences] [Google Scholar]
- Makrygianni, L., Arcavi, I., Newsome, M., et al. 2025, ApJ, 987, L20 [Google Scholar]
- Malyali, A., Rau, A., Merloni, A., et al. 2021, A&A, 647, A9 [NASA ADS] [CrossRef] [EDP Sciences] [Google Scholar]
- McKernan, B., Ford, K. E. S., Cantiello, M., et al. 2022, MNRAS, 514, 4102 [CrossRef] [Google Scholar]
- Merloni, A., Dwelly, T., Salvato, M., et al. 2015, MNRAS, 452, 69 [Google Scholar]
- Milán Veres, P. 2025, Astron. Nachr., submitted [arXiv:2512.10764] [Google Scholar]
- Mummery, A., van Velzen, S., Nathan, E., et al. 2024, MNRAS, 527, 2452 [Google Scholar]
- Pasham, D., Coughlin, E. R., Guolo, M., et al. 2024, ApJ, 971, L31 [Google Scholar]
- Payne, A. V., Shappee, B. J., Hinkle, J. T., et al. 2021, ApJ, 910, 125 [NASA ADS] [CrossRef] [Google Scholar]
- Payne, A. V., Shappee, B. J., Hinkle, J. T., et al. 2022, ApJ, 926, 142 [NASA ADS] [CrossRef] [Google Scholar]
- Peterson, B. M., Ferrarese, L., Gilbert, K. M., et al. 2004, ApJ, 613, 682 [Google Scholar]
- Petrushevska, T., Leloudas, G., Ilić, D., et al. 2023, A&A, 669, A140 [NASA ADS] [CrossRef] [EDP Sciences] [Google Scholar]
- Predehl, P., Andritschke, R., Arefiev, V., et al. 2021, A&A, 647, A1 [EDP Sciences] [Google Scholar]
- Quintin, E., Russeil, E., Llamas Lanza, M., et al. 2025, A&A, submitted [arXiv:2511.19016] [Google Scholar]
- Rees, M. J. 1988, Nature, 333, 523 [Google Scholar]
- Ryu, T., Krolik, J., Piran, T., & Noble, S. C. 2020, ApJ, 904, 100 [NASA ADS] [CrossRef] [Google Scholar]
- Ryu, T., McKernan, B., Ford, K. E. S., et al. 2024, MNRAS, 527, 8103 [Google Scholar]
- Schlafly, E. F., & Finkbeiner, D. P. 2011, ApJ, 737, 103 [Google Scholar]
- Śniegowska, M., Trakhtenbrot, B., Makrygianni, L., et al. 2025, ApJ, 989, 173 [Google Scholar]
- Somalwar, J. J., Ravi, V., Yao, Y., et al. 2026, ApJ, 985, 175 [Google Scholar]
- Stein, R., Ahumada, T., Angus, C., et al. 2024, TNSAN, 221, 1 [Google Scholar]
- Sun, L., Jiang, N., Dou, L., et al. 2024, A&A, 692, A262 [NASA ADS] [CrossRef] [EDP Sciences] [Google Scholar]
- Sun, J., Guo, H., Gu, M., et al. 2025, ApJ, 982, 150 [Google Scholar]
- Tadhunter, C., Spence, R., Rose, M., Mullaney, J., & Crowther, P. 2017, Nat. Astron., 1, 0061 [NASA ADS] [CrossRef] [Google Scholar]
- Trakhtenbrot, B., Arcavi, I., Ricci, C., et al. 2019, Nat. Astron., 3, 242 [Google Scholar]
- Tucker, M. A., Shappee, B. J., Hinkle, J. T., et al. 2021, MNRAS, 506, 6014 [Google Scholar]
- van Velzen, S., Gezari, S., Hung, T., et al. 2019, ATel, 12568, 1 [Google Scholar]
- van Velzen, S., Gezari, S., Hammerstein, E., et al. 2021, ApJ, 908, 4 [NASA ADS] [CrossRef] [Google Scholar]
- van Velzen, S., Stein, R., Gilfanov, M., et al. 2024, MNRAS, 529, 2559 [CrossRef] [Google Scholar]
- Veres, P. M., Franckowiak, A., van Velzen, S., et al. 2026, A&A, 706, A324 [NASA ADS] [CrossRef] [EDP Sciences] [Google Scholar]
- Wang, Y., Baldi, R. D., del Palacio, S., et al. 2023, MNRAS, 520, 2417 [NASA ADS] [CrossRef] [Google Scholar]
- Wang, Y., Pasham, D. R., Altamirano, D., et al. 2024a, ApJ, 962, 78 [Google Scholar]
- Wang, Y., Wang, T., Jiang, N., et al. 2024b, ApJ, 966, 136 [Google Scholar]
- Wang, Y., Wang, T., Huang, S., et al. 2025, arXiv e-prints [arXiv:2510.26561] [Google Scholar]
- Wen, S., Jonker, P. G., Levan, A. J., et al. 2024, ApJ, 970, 116 [Google Scholar]
- Wevers, T., Pasham, D. R., van Velzen, S., et al. 2019, MNRAS, 488, 4816 [Google Scholar]
- Wevers, T., Nicholl, M., Guolo, M., et al. 2022, A&A, 666, A6 [NASA ADS] [CrossRef] [EDP Sciences] [Google Scholar]
- Wevers, T., Coughlin, E. R., Pasham, D. R., et al. 2023, ApJ, 942, L33 [NASA ADS] [CrossRef] [Google Scholar]
- Wright, E. L. 2006, PASP, 118, 1711 [NASA ADS] [CrossRef] [Google Scholar]
- Zhang, M., Zhang, W., Deng, H., Guo, H., & Sun, J. 2025, ApJ, 993, 244 [Google Scholar]
- Zhong, S. 2025, ApJ, 983, 131 [Google Scholar]
A line fluorescence process, that excites O III and N III lines in the optical and near-UV (Bowen 1934, 1935), often detected in TDEs.
Unfortunately, only sparse sampling is available for AT2020vdq during the rise of its second flare while other reported pTDEs in literature exhibited X-ray-only re-brightenings.
Appendix A: The precursor sample
Precursor sample.
Appendix B: Light curves of the precursor sample
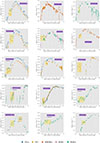 |
Fig. B.1. Optical light curves of our precursor sample. We show the differential (i.e., host-subtracted) light curves, with the only exception of AT2023uqm, whose precursor flare mainly exhibits negative fluxes (i.e., fainter than the baseline emission); in this case, we show the aperture photometry. The precursor features are highlighted (yellow shaded areas). ASASSN-14ko, in which case the re-brightening during decline was studied earlier in detail, is also highlighted (orange shaded area). Days are always in rest frame. The light curves were binned only for intranight observations to improve the signal-to-noise ratio, unless stated otherwise in the figure annotations. |
Appendix C: Long-term light curves of the repeating TDEs
We present the long-term optical light curves of the repeating TDEs with double flares. WISE infrared light curves are also shown on top, retrieved using TIMEWISE.7
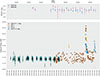 |
Fig. C.1. Long-term optical light curve of the spectroscopically confirmed repeating pTDE AT2022dbl. We plotted ZTF aperture magnitudes in order to be consistent with the CRTS and Gaia photometries, which are not corrected for baseline. No enhanced infrared emission was detected by WISE after the first optical flare, while no data is available after the second. |
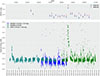 |
Fig. C.2. Long-term optical light curve of the repeating TDE AT2019azh presented in aperture magnitudes. The second flare appeared 14 years after the first flare detected by CRTS. Two individual TDE scenarios and a repeating pTDE scenario are discussed in more detail in the main text. The second flare was accompanied by an IR dust echo flare; no data is available after the first flare for comparison. |
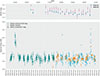 |
Fig. C.3. Long-term optical light curve of the repeating TDE AT2024pvu presented in aperture magnitudes. The second flare appeared 18 years after the first flare detected by CRTS. Two individual TDE scenarios and a repeating pTDE scenario are discussed in more detail in the main text. Unfortunately, no WISE observations were obtained after the second optical flare, due to the satellite’s shutdown. |
All Tables
All Figures
|
Fig. 1. Positive trend between the earlier occurrence time of the precursors and the mass of the central SMBH. We define the occurrence time as the time when the optical emission reached its highest value during the precursor flare; the x-axis uncertainties represent the duration of the precursor. The black hole mass estimates are explained in detail in the text. We excluded AT2022fpx from the fit due to lack of observations around the precursor. |
| In the text | |
|
Fig. B.1. Optical light curves of our precursor sample. We show the differential (i.e., host-subtracted) light curves, with the only exception of AT2023uqm, whose precursor flare mainly exhibits negative fluxes (i.e., fainter than the baseline emission); in this case, we show the aperture photometry. The precursor features are highlighted (yellow shaded areas). ASASSN-14ko, in which case the re-brightening during decline was studied earlier in detail, is also highlighted (orange shaded area). Days are always in rest frame. The light curves were binned only for intranight observations to improve the signal-to-noise ratio, unless stated otherwise in the figure annotations. |
| In the text | |
|
Fig. C.1. Long-term optical light curve of the spectroscopically confirmed repeating pTDE AT2022dbl. We plotted ZTF aperture magnitudes in order to be consistent with the CRTS and Gaia photometries, which are not corrected for baseline. No enhanced infrared emission was detected by WISE after the first optical flare, while no data is available after the second. |
| In the text | |
|
Fig. C.2. Long-term optical light curve of the repeating TDE AT2019azh presented in aperture magnitudes. The second flare appeared 14 years after the first flare detected by CRTS. Two individual TDE scenarios and a repeating pTDE scenario are discussed in more detail in the main text. The second flare was accompanied by an IR dust echo flare; no data is available after the first flare for comparison. |
| In the text | |
|
Fig. C.3. Long-term optical light curve of the repeating TDE AT2024pvu presented in aperture magnitudes. The second flare appeared 18 years after the first flare detected by CRTS. Two individual TDE scenarios and a repeating pTDE scenario are discussed in more detail in the main text. Unfortunately, no WISE observations were obtained after the second optical flare, due to the satellite’s shutdown. |
| In the text | |
Current usage metrics show cumulative count of Article Views (full-text article views including HTML views, PDF and ePub downloads, according to the available data) and Abstracts Views on Vision4Press platform.
Data correspond to usage on the plateform after 2015. The current usage metrics is available 48-96 hours after online publication and is updated daily on week days.
Initial download of the metrics may take a while.