Fig. 1.
Download original image
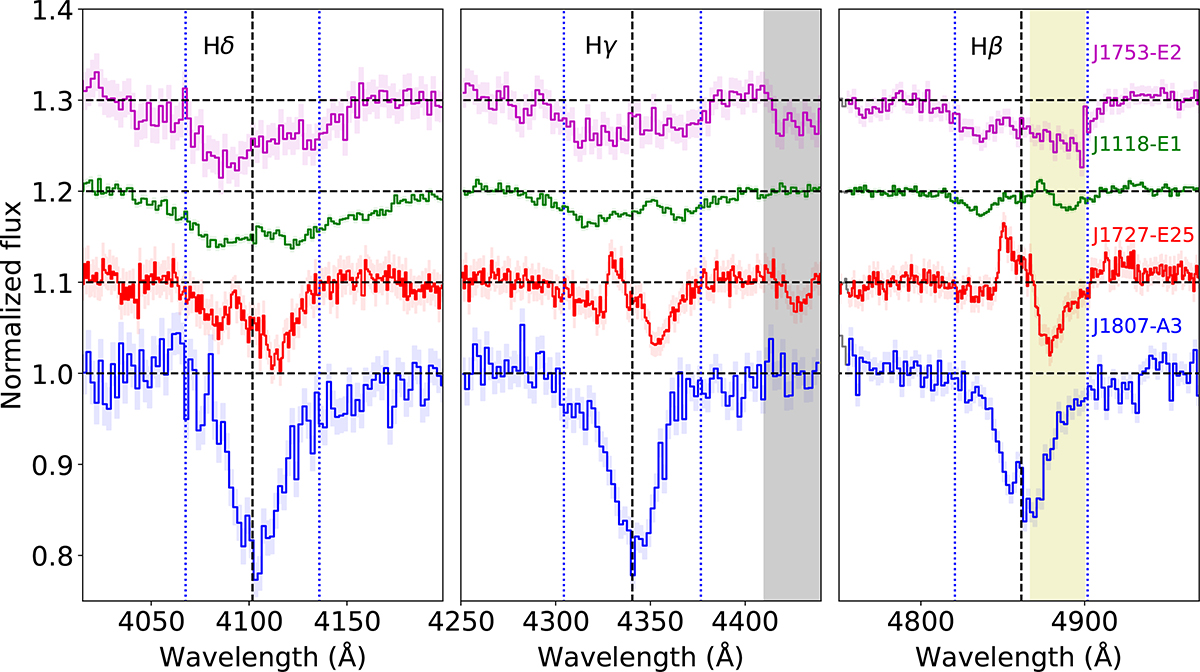
Optical spectra from our database, zoomed in on the Balmer Hδ, Hγ, and Hβ transitions. They all show BAs with cores partially filled by the emission line. From bottom to top: J1807 (epoch 3 of dataset A, blue), J1727 (epoch 25, red), J1118 (epoch 1, green), and J1753 (epoch 2, magenta). Telluric bands and DIBs are shown as grey and yellow-shaded regions, respectively. The rest wavelength of the transition is marked with a dashed black line, while dotted blue lines mark velocity shifts of ±2500 km s−1 as a visual reference.
Current usage metrics show cumulative count of Article Views (full-text article views including HTML views, PDF and ePub downloads, according to the available data) and Abstracts Views on Vision4Press platform.
Data correspond to usage on the plateform after 2015. The current usage metrics is available 48-96 hours after online publication and is updated daily on week days.
Initial download of the metrics may take a while.