Fig. C.2.
Download original image
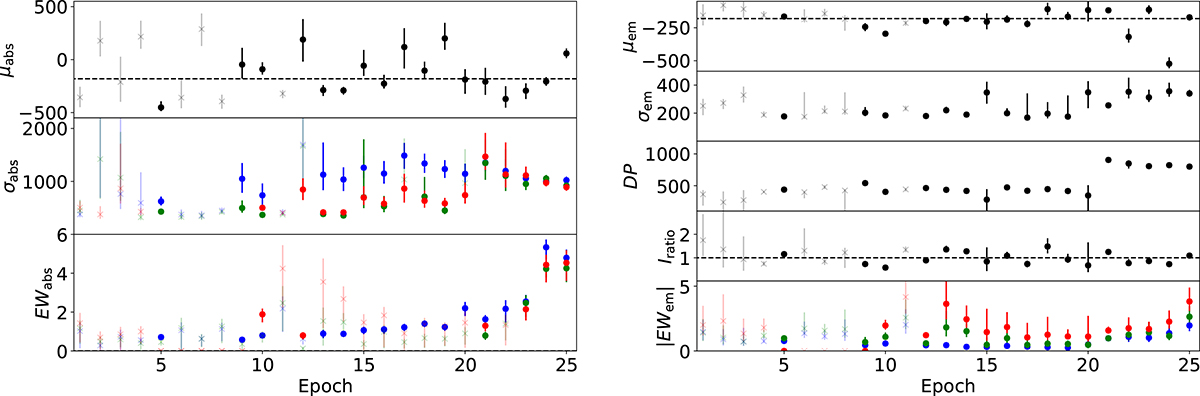
Best fitting parameters for the complete spectroscopic sample of J1727 (see Fig. C.1). The left figure contains parameters associated with the absorption component, while the right figure shows the emission component parameters. For those parameters that are independent for each of the fitted lines, the following colour code applies: ![]() (blue),
(blue), ![]() (green), and
(green), and ![]() (red). The black-dashed line in the top panel marks the systemic velocity reported in the text. Transparent points mark best-fit solutions where EWabs is consistent with 0 within 3σ, and therefore consistent with a non-detection of BA. A similar line in the Iratio panel marks the symmetric profile (Iratio = 1). Units are [
(red). The black-dashed line in the top panel marks the systemic velocity reported in the text. Transparent points mark best-fit solutions where EWabs is consistent with 0 within 3σ, and therefore consistent with a non-detection of BA. A similar line in the Iratio panel marks the symmetric profile (Iratio = 1). Units are [![]() ] for μabs, μem, σabs, μem, DP; and [
] for μabs, μem, σabs, μem, DP; and [![]() ] for EWabs and |EWem|.
] for EWabs and |EWem|.
Current usage metrics show cumulative count of Article Views (full-text article views including HTML views, PDF and ePub downloads, according to the available data) and Abstracts Views on Vision4Press platform.
Data correspond to usage on the plateform after 2015. The current usage metrics is available 48-96 hours after online publication and is updated daily on week days.
Initial download of the metrics may take a while.