Fig. C.5.
Download original image
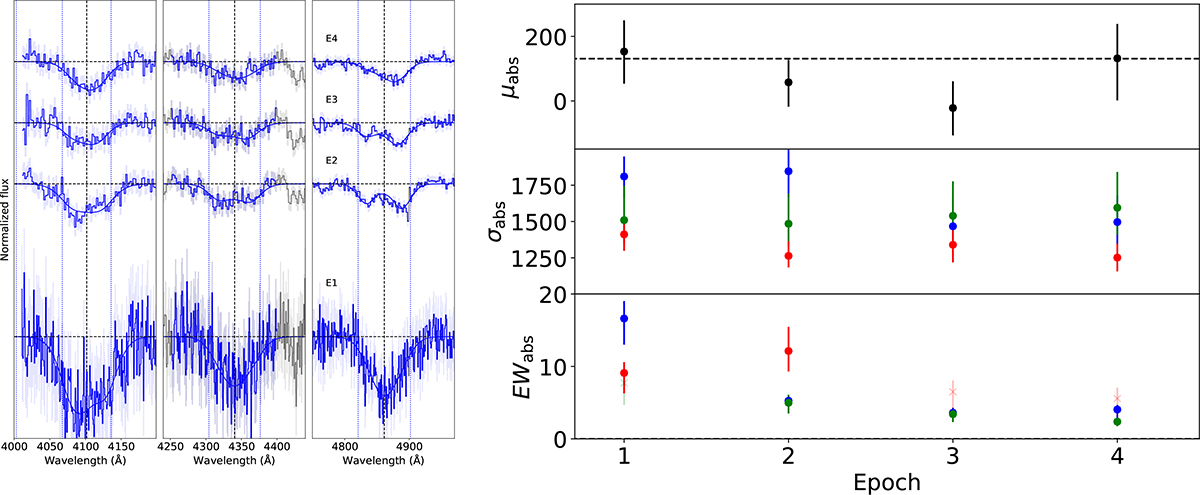
Left panel: J1753 spectra showing the BAs evolution during its 2023 outburst, zoomed into the Balmer ![]() ,
, ![]() , and
, and ![]() transitions. The colour of the spectra corresponds to the X-ray spectral state, following the same convention as in Fig. C.1. The best fit corresponding with the parameters shown in the right panel is shown as a solid blue line. The rest wavelength of the transition is marked with a dashed black line, while blue-dotted lines mark velocity shifts of
transitions. The colour of the spectra corresponds to the X-ray spectral state, following the same convention as in Fig. C.1. The best fit corresponding with the parameters shown in the right panel is shown as a solid blue line. The rest wavelength of the transition is marked with a dashed black line, while blue-dotted lines mark velocity shifts of ![]() as a visual reference. Black regions of the spectra were masked during the fit due to the presence of a telluric band. Right panel: Best fitting parameters for the spectroscopic sample of J1357, following the same description as in Fig. C.2.
as a visual reference. Black regions of the spectra were masked during the fit due to the presence of a telluric band. Right panel: Best fitting parameters for the spectroscopic sample of J1357, following the same description as in Fig. C.2.
Current usage metrics show cumulative count of Article Views (full-text article views including HTML views, PDF and ePub downloads, according to the available data) and Abstracts Views on Vision4Press platform.
Data correspond to usage on the plateform after 2015. The current usage metrics is available 48-96 hours after online publication and is updated daily on week days.
Initial download of the metrics may take a while.