Fig. 2.
Download original image
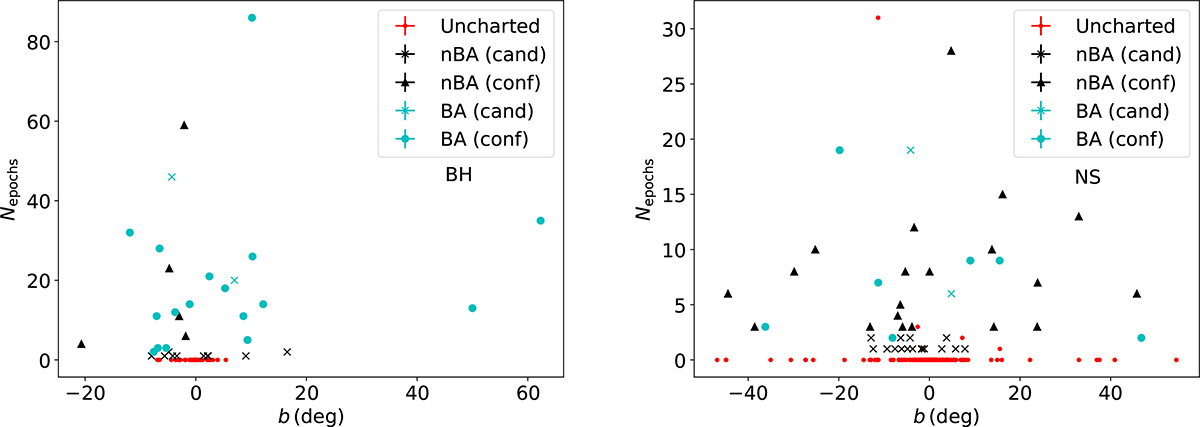
b against Nepoch for the BH (left) and NS (right) population. Cyan symbols refer to systems with detected BA features (crosses for candidates, filled circles for confirmed systems), black symbols to non-BA systems (crosses for candidates, filled triangles for confirmed systems), and red dots to systems without available spectroscopic data (also known as uncharted).
Current usage metrics show cumulative count of Article Views (full-text article views including HTML views, PDF and ePub downloads, according to the available data) and Abstracts Views on Vision4Press platform.
Data correspond to usage on the plateform after 2015. The current usage metrics is available 48-96 hours after online publication and is updated daily on week days.
Initial download of the metrics may take a while.