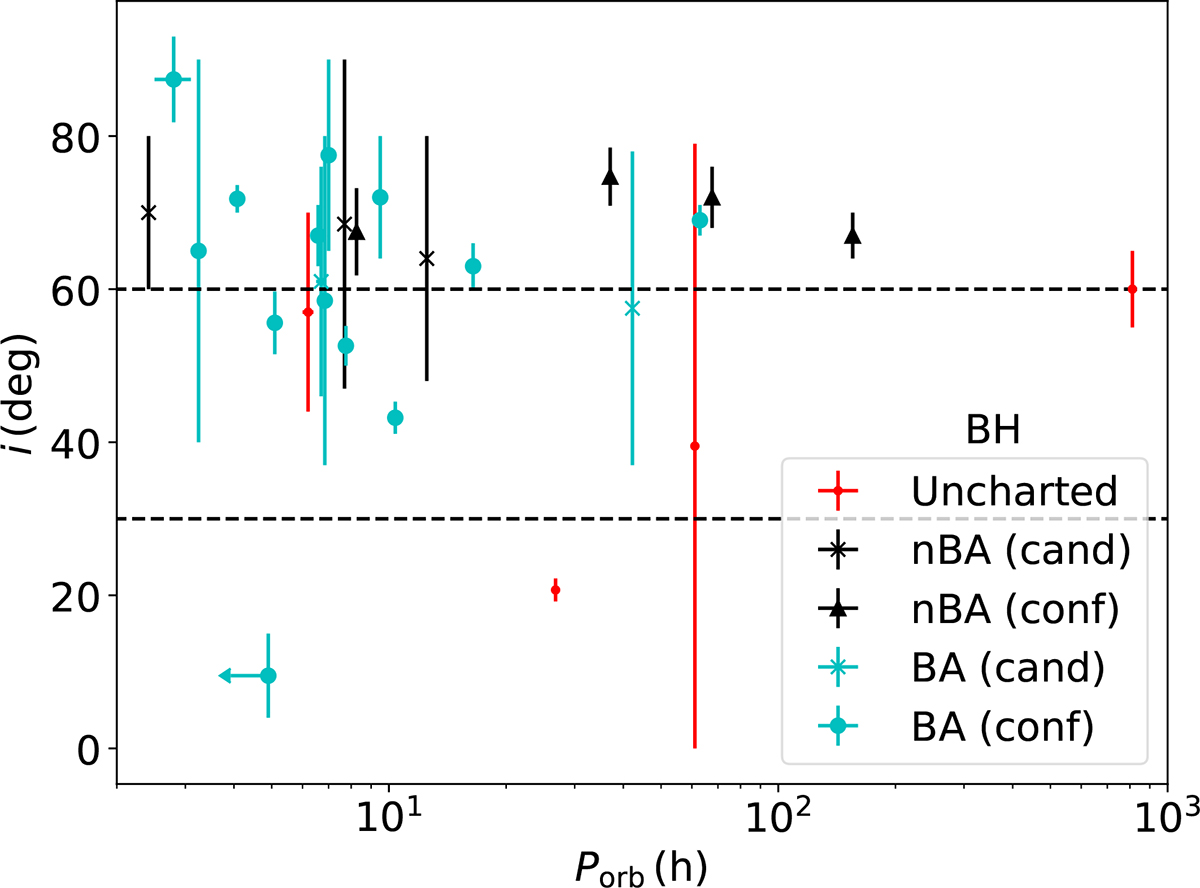
Fig. 4.
Download original image
Porb against i for the BH population. The colour and symbol description matches that of Fig. 2. Dashed lines mark the thresholds at 30° and 60° that define the low, mid, and high inclination regions. If only constraints to the i parameter are available, we plot the central value and use the range as the associated uncertainty.
Current usage metrics show cumulative count of Article Views (full-text article views including HTML views, PDF and ePub downloads, according to the available data) and Abstracts Views on Vision4Press platform.
Data correspond to usage on the plateform after 2015. The current usage metrics is available 48-96 hours after online publication and is updated daily on week days.
Initial download of the metrics may take a while.