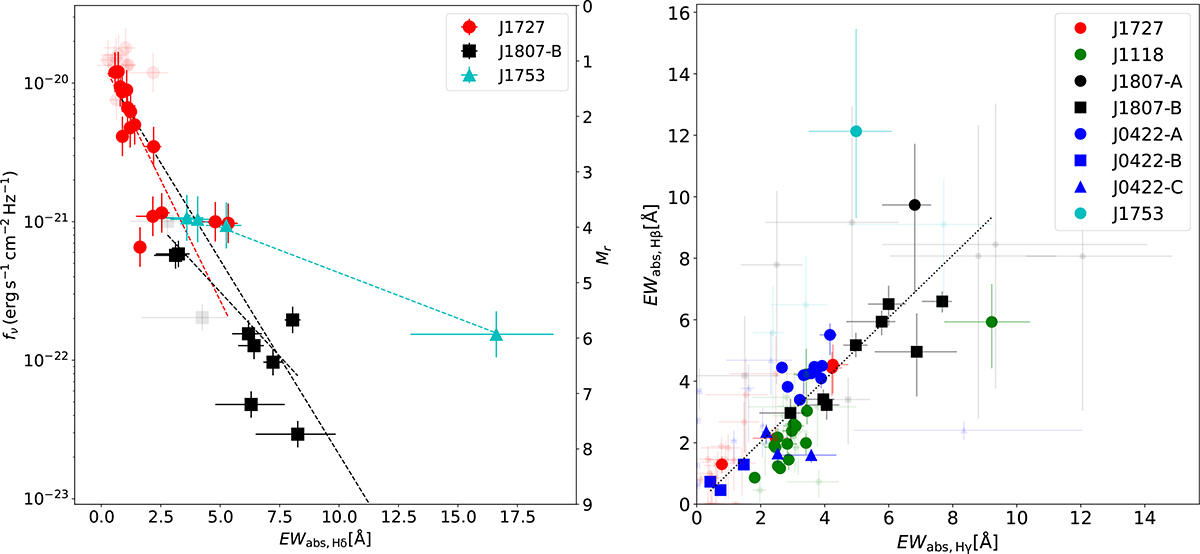
Fig. 5.
Download original image
Left panel: EWabs, Hδ against r-band brightness (left axis for flux density units, fν; right axis for absolute magnitudes, Mr) from the best-fitting results of the subsample with flux-calibrated spectra. The colour code marks the systems associated with each data point. A dashed black line depicts the best linear fit to the correlation, and dashed cyan, dashed red, and dashed black lines are the equivalent for individual datasets. Right panel: EWabs, Hβ against EWabs, Hγ from the best-fitting results of the whole spectroscopic sample. The colour code marks the systems associated with each data point, while symbols differentiate between subsets as described in the legend. A dashed black line depicts the best linear fit to the correlation, which is consistent with a 1:1 ratio. Transparent symbols correspond to fitting parameters that are consistent with null BA within 3σ.
Current usage metrics show cumulative count of Article Views (full-text article views including HTML views, PDF and ePub downloads, according to the available data) and Abstracts Views on Vision4Press platform.
Data correspond to usage on the plateform after 2015. The current usage metrics is available 48-96 hours after online publication and is updated daily on week days.
Initial download of the metrics may take a while.