Fig. 8.
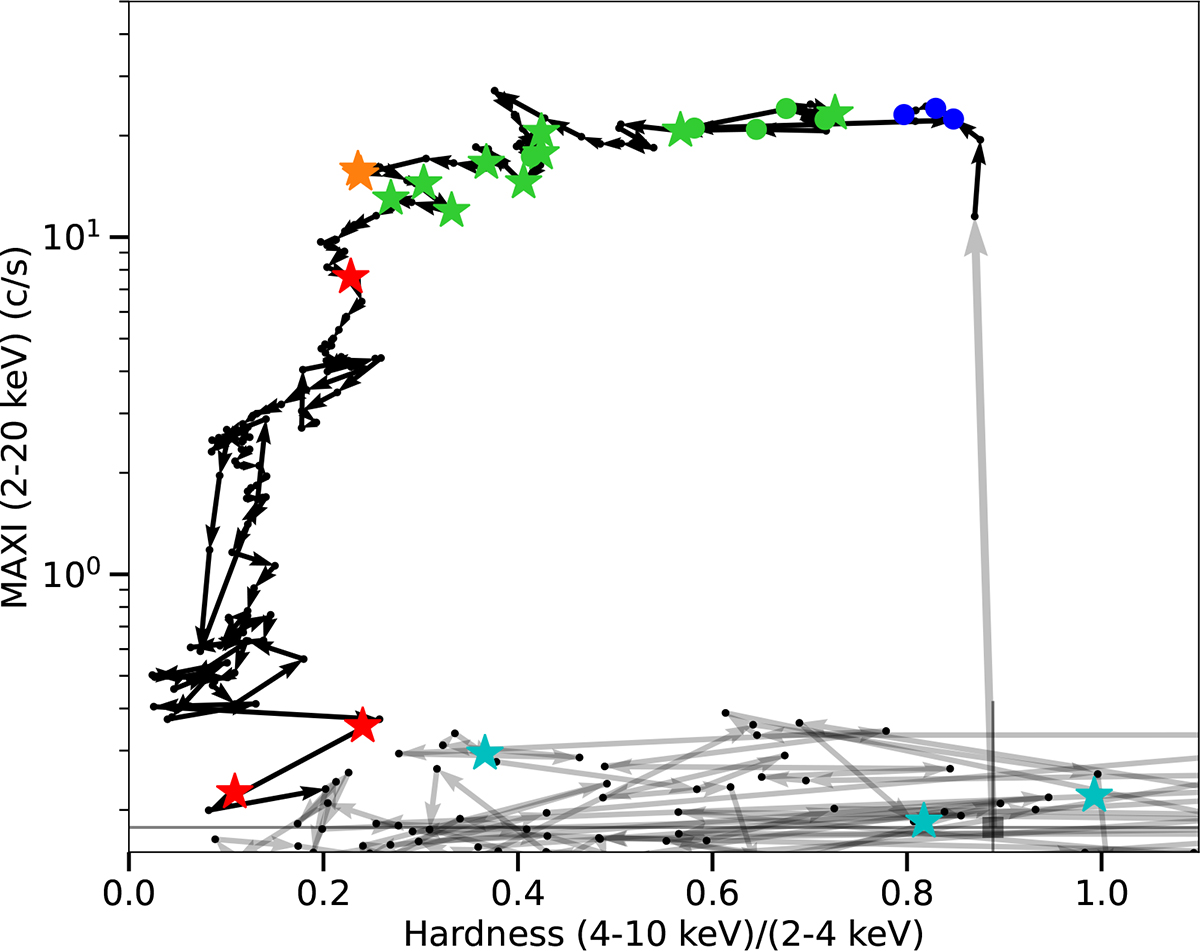
Download original image
Hardness-intensity diagram of J1727 (arrow-connected black dots; grey for low X-ray fluxes with colours possibly affected by background subtraction). The coloured symbols mark the epochs where our optical spectroscopy was obtained. The filled circles mark spectra where no BAs were detected, while filled stars correspond to BA detection in at least one of the inspected transitions (see Section 3). The colour code separates the initial rise in the hard state (blue), hard-intermediate state (HIMS, green), and soft-intermediate state (SIMS, orange), as well as the soft state decay (red). The last five epochs, published for the first time in this work, correspond to the final decay during the soft state and the subsequent transition to the low-luminosity hard state (cyan).
Current usage metrics show cumulative count of Article Views (full-text article views including HTML views, PDF and ePub downloads, according to the available data) and Abstracts Views on Vision4Press platform.
Data correspond to usage on the plateform after 2015. The current usage metrics is available 48-96 hours after online publication and is updated daily on week days.
Initial download of the metrics may take a while.