Fig. 1.
Download original image
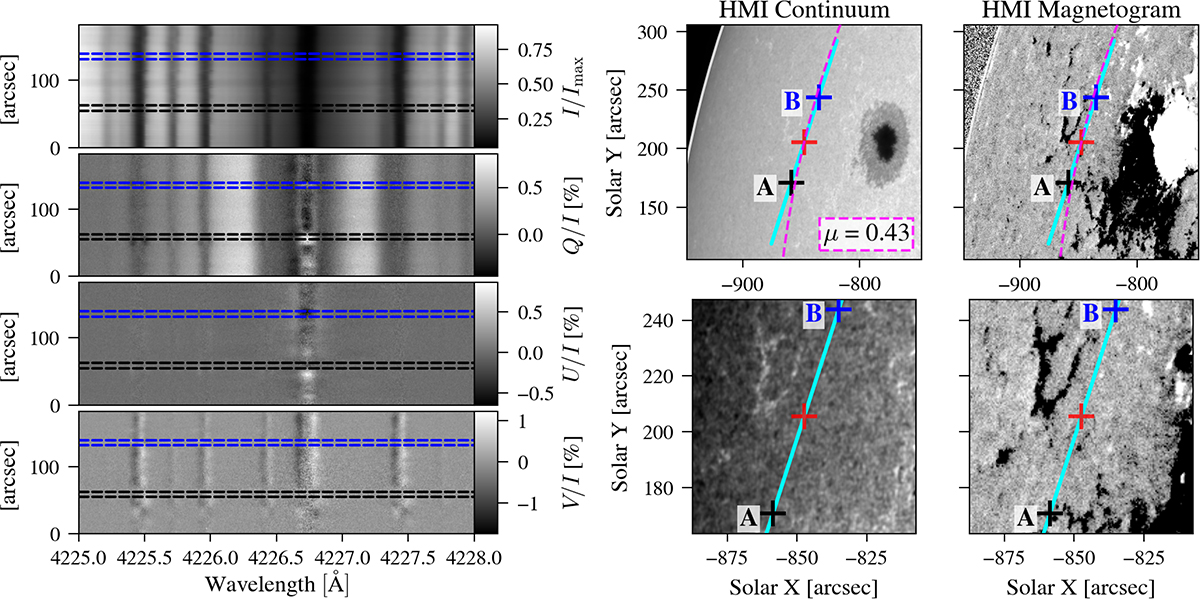
Left: Observed slit-spectra of the Ca I 4227 Stokes vector, whereby the horizontal blue and black dashed lines indicate the spatial regions considered for the inversion. Center and right: Context of the observation given by the continuum and magnetogram (clipped at ±50 gauss) image of HMI on board SDO. The cyan line represents the slit (width not to scale), with the red cross indicating its center, placed at a limb distance of μ = 0.43 (see magenta dashed lines). The blue and black crosses on the slit-spectra images mark the centers of two spatial regions, labeled as A and B, which were considered for the inversion.
Current usage metrics show cumulative count of Article Views (full-text article views including HTML views, PDF and ePub downloads, according to the available data) and Abstracts Views on Vision4Press platform.
Data correspond to usage on the plateform after 2015. The current usage metrics is available 48-96 hours after online publication and is updated daily on week days.
Initial download of the metrics may take a while.