Fig. 2.
Download original image
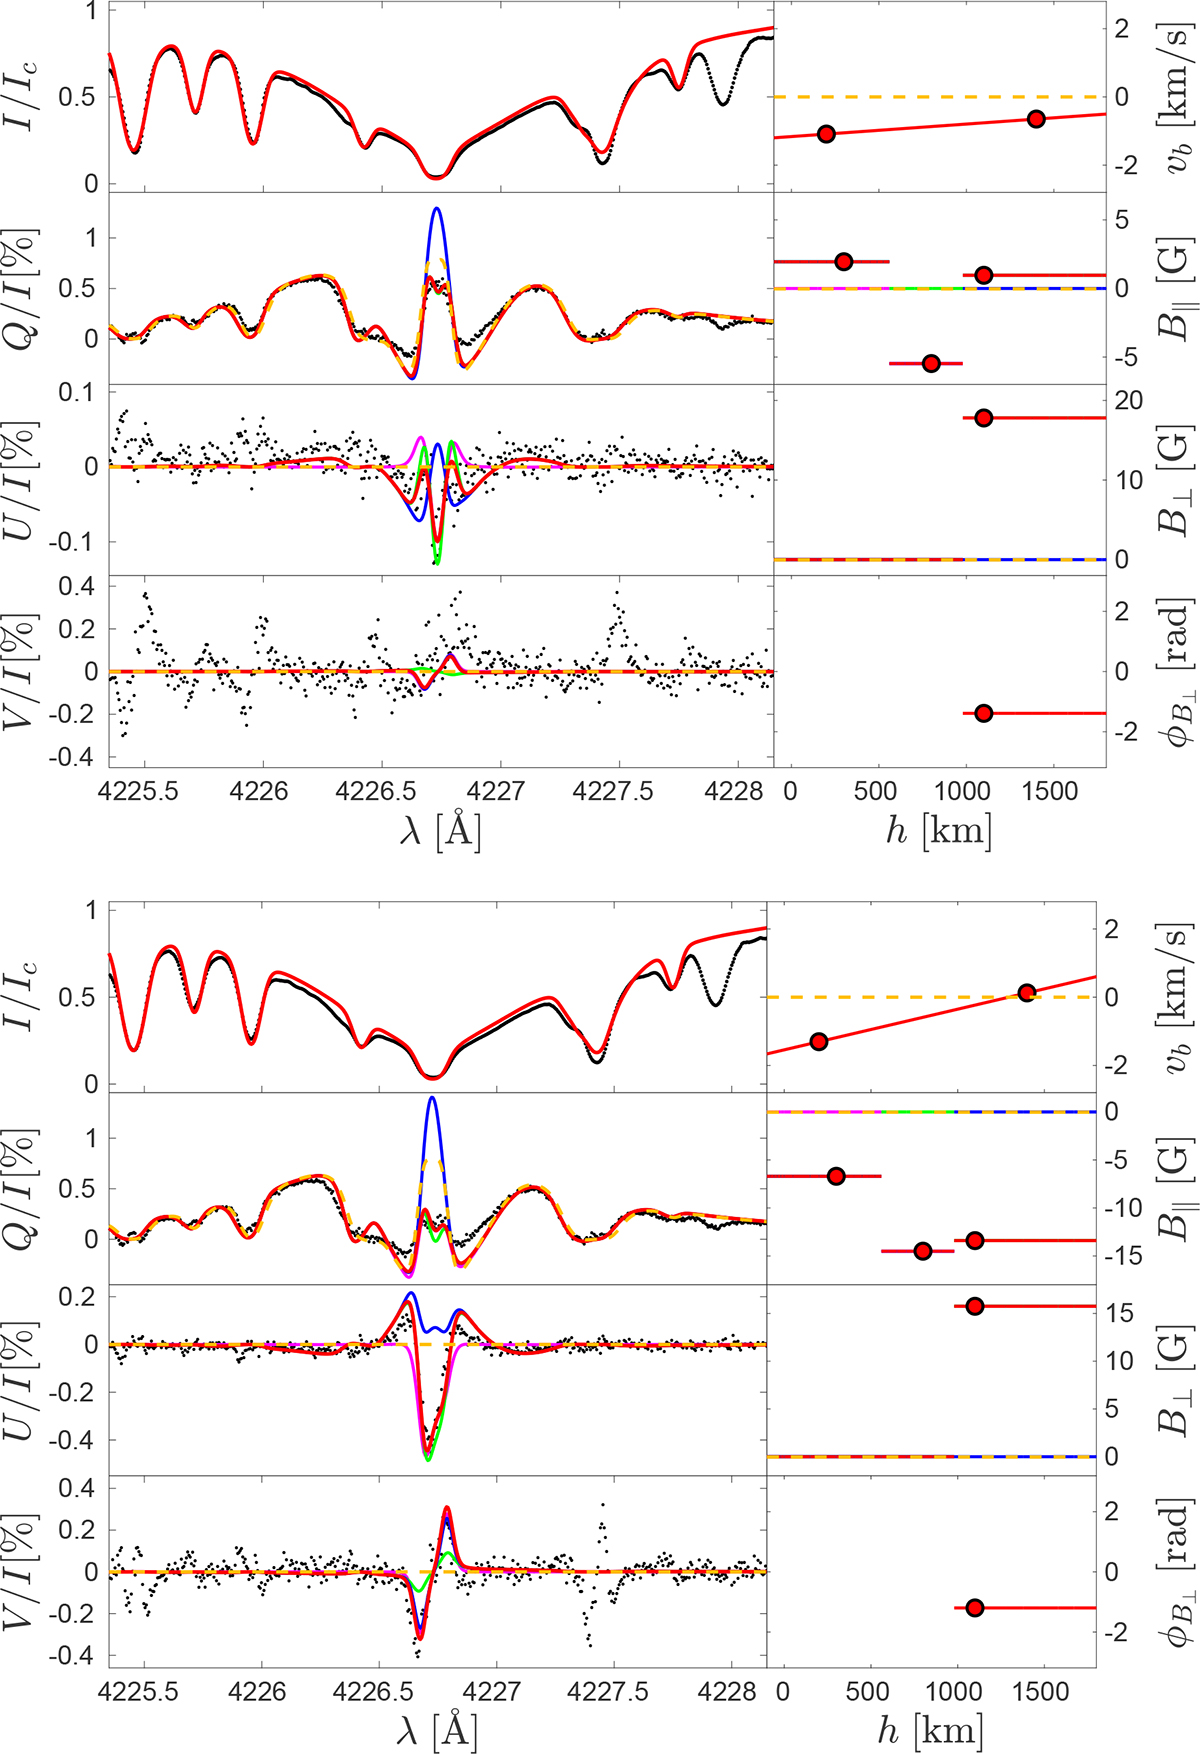
Inversion results for regions A (upper tile) and B (lower tile). Left panels (from top to bottom): Observed (black dots) and inverted (red solid lines) I/Ic, Q/I, U/I, and V/I profiles at μ = 0.43. Right panels (from top to bottom): Two-node fitted vertical bulk velocities and three-node fitted magnetic field components B∥, B⊥, and ϕB⊥. As a reference, we also show the Stokes profiles obtained in the absence of bulk velocity and magnetic fields (orange dashed lines). In addition, we included the synthetic Stokes profiles obtained for the inferred magnetic field stratification after switching off the magnetic field one node at a time (deepest to highest, corresponding to the magenta, green, and blue solid lines, respectively).
Current usage metrics show cumulative count of Article Views (full-text article views including HTML views, PDF and ePub downloads, according to the available data) and Abstracts Views on Vision4Press platform.
Data correspond to usage on the plateform after 2015. The current usage metrics is available 48-96 hours after online publication and is updated daily on week days.
Initial download of the metrics may take a while.