Fig. 5.
Download original image
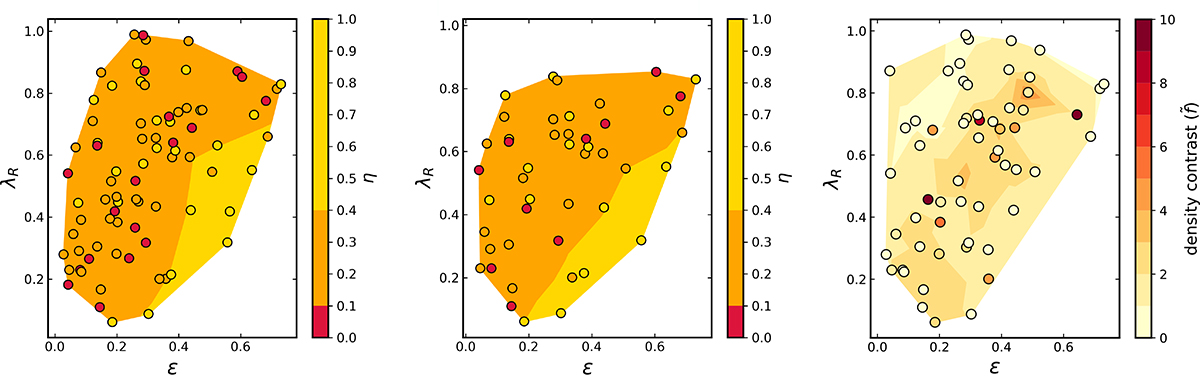
Updated λR − ϵ plane, colour-coded by two different environmental indicators. The background in all panels shows a LOESS-smoothed version of the dots above. Left: η indicator computed using the FoF algorithm for all galaxies detected in groups. Middle: η indicator computed using the FoF algorithm for galaxies detected in groups with ten members or fewer. Right: Density contrast (![]() ) estimator obtained from the Voronoi tessellation method. This figure corresponds to the updated version of Figure 8 in Muñoz López et al. (2024).
) estimator obtained from the Voronoi tessellation method. This figure corresponds to the updated version of Figure 8 in Muñoz López et al. (2024).
Current usage metrics show cumulative count of Article Views (full-text article views including HTML views, PDF and ePub downloads, according to the available data) and Abstracts Views on Vision4Press platform.
Data correspond to usage on the plateform after 2015. The current usage metrics is available 48-96 hours after online publication and is updated daily on week days.
Initial download of the metrics may take a while.