| Issue |
A&A
Volume 707, March 2026
|
|
|---|---|---|
| Article Number | C4 | |
| Number of page(s) | 4 | |
| Section | Extragalactic astronomy | |
| DOI | https://doi.org/10.1051/0004-6361/202659136e | |
| Published online | 20 March 2026 | |
Stellar angular momentum of intermediate-redshift galaxies in MUSE surveys (Corrigendum)
1
Leibniz-Institut für Astrophysik Potsdam (AIP), An der Sternwarte 16, 14482, Potsdam, Germany
2
Canada-France-Hawaii Telescope, 65-1238 Mamalahoa Highway, Kamuela, HI, 96743, USA
3
Aix Marseille Univ., CNRS, CNES, LAM, Marseille, France
4
Institut de Recherche en Astrophysique et Planétologie (IRAP), Université de Toulouse, CNRS, UPS, CNES, Toulouse, France
5
Centre de Recherche Astrophysique de Lyon UMR5574, Univ. Lyon1, ENS de Lyon, CNRS, F-69230, Saint-Genis-Laval, France
6
Max Planck Institute for Astronomy, Königstuhl 17, 69117, Heidelberg, Germany
⋆ Corresponding author: This email address is being protected from spambots. You need JavaScript enabled to view it.
Key words: galaxies: evolution / galaxies: formation / galaxies: kinematics and dynamics / errata, addenda
1. Introduction
This is an erratum of Muñoz López et al. (2024) addressing the miscalculated values of the spin parameter, λR, defined by Eq. (1) (Eq. 1 in the original publication):
 (1)
(1)
When calculating the spin parameter, the galaxy’s systemic velocity was not subtracted from the mean stellar velocity (V), resulting in an inaccurate estimation of the spin parameter. The typical galaxy’s systemic velocity was ∼70 km/s, which resulted in an average error of ∼15% for λR.
We present here the corrected values of λR and the updated versions of the corresponding figures (Figures 4–9 in the original publication). We also report the updated values of λR in column (3) of Table 1, which complements Table B.1 in the original publication.
Updated spin parameters for the galaxy sample.
The change in the λR values requires updating several plots from the original paper. Nevertheless, the main conclusions of this paper remain unchanged. The main changes are:
-
For most galaxies, their λR values are lower than previously reported, which makes our sample more similar to galaxies in the local Universe.
-
We find three slow rotators within the redshift range of the sample (instead of one).
-
The trend in low-mass galaxies with high star formation rates (SFR) (located above the main sequence in the stellar mass-SFR diagram) toward lower spin parameters is now more pronounced and resembles that seen in the z = 0 galaxy population.
2. Updated figures
2.1. Observed spin parameter
In Figure 1 we present the updated version of Figure 4 from the original publication. The main consequence of removing the galaxy’s systematic velocity when computing the spin parameter is the resulting lower values of λR for all the galaxy’s ellipticity bins shown in the figure. Our main conclusions – that the sample is dominated by round galaxies and that the observed radial λR profiles do not change dramatically between 0.5 and 2 Re – remain unaltered.
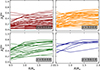 |
Fig. 1. Updated observed stellar angular momentum profile for the sample galaxy for different aperture radii (0.5, 1.0, 1.5, and 2 Re) relative to the effective radius. The values are not seeing-corrected. The colours indicate the galaxy ellipticity ϵ, which is also indicated in each panel. This figure corresponds to the updated version of Figure 4 in Muñoz López et al. (2024). |
2.2. Atmospheric seeing corrections for λR
Figure 2 shows the updated version of Figure 5 in the original paper. As most of the observed stellar angular momentum values in the sample decreased (i.e. lower  values), we corrected additional galaxies for the point spread function (PSF) effects using
 (2)
(2)
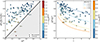 |
Fig. 2. Updated corrections for the spin parameter in the galaxy sample. Both panels (left and right) are colour-coded by the ratio (r) of the galaxy’s angular size to the PSF, given by the major-axis Rmaj and σPSF, respectively. The ratio r is a parameter that quantifies how well-resolved a galaxy is. Left: Generalized Moffat and empirical fn functions as correction indicators from Graham et al. (2018) and their dependence on the observed (measured) stellar spin parameter, the galaxy angular size, and the width of the PSF. The shaded part of the plot indicates the region where the galaxy spin parameter correction is not physical, leading to |

In Equation (2), the parameters referring to the galaxy’s angular size and the PSF, given by the major-axis Rmaj and σPSF, remain unchanged. Therefore, given the new values of λR, more galaxies have parameter combinations where  , the gM2, and the fn functions result in
  . This is manifested by the correction of 101 out of 106 galaxies (compared to 80 in Muñoz López et al. 2024).
2.3. Stellar spin parameter
In Figure 3 we present the updated version of Figure 6 in Muñoz López et al. (2024). Our original results remain unchanged with the following exceptions:
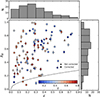 |
Fig. 3. Updated λR as a function of ellipticity, colour-coded by redshift, for the 106 sample galaxies, with histograms. The circles indicate galaxies where the spin parameter was corrected for atmospheric seeing; the value corresponds to the intrinsic stellar angular momentum ( |


-
There is a decrease in the number of galaxies with high angular momentum.
-
The fraction of galaxies with λR ≥ 0.8 diminishes.
-
The fraction of galaxies with λR < 0.8 increases.
-
Additionally, galaxy 73, galaxy 51, and galaxy 71 are now classified as slow rotators. All three galaxies have spin parameters corrected for atmospheric seeing. These systems account for a total of three slow-rotating galaxies in the sample.
Galaxies 51 and 71 are at z = 0.62 and z = 0.69, respectively, with low star formation rates: log10(SFR) ≈ −0.59 M⊙ yr−1 and log10(SFR) ≈ −1.25 M⊙ yr−1. Both galaxies are massive with stellar masses of 1011.4 M⊙ and 1010.5 M⊙, respectively.
Figure 4 is the updated version of Figure 7 in the original publication. We observed that the two additional slow rotators (galaxies 51 and 71) lie in the most massive stellar mass bin.
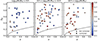 |
Fig. 4. Updated λR as a function of galaxy ellipticity, colour-coded by redshift, for the three different mass bins indicated in the top part of each panel. The dashed black lines denote the threshold between slow and fast rotators. Uncorrected and corrected λR values are indicated by triangles and circles, respectively. This figure corresponds to the updated version of Figure 7 in Muñoz López et al. (2024). |
2.4. Environment indicators
We present the updated version of Figure 8 (Muñoz López et al. 2024) in Figure 5. In the middle panel of Figure 5, no galaxies have λR > 0.8, indicating that all galaxies with λR < 0.8 belong to groups with more than ten members. Thus, group galaxies with λR > 0.8 belong to less massive groups (fewer than ten members), as observed in the left panel.
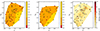 |
Fig. 5. Updated λR − ϵ plane, colour-coded by two different environmental indicators. The background in all panels shows a LOESS-smoothed version of the dots above. Left: η indicator computed using the FoF algorithm for all galaxies detected in groups. Middle: η indicator computed using the FoF algorithm for galaxies detected in groups with ten members or fewer. Right: Density contrast ( |

Due to the changes in λR, more galaxies now fall within the parameter range where the PSF correction is stronger (right panel of Figure 5). However, the point distributions in the original and updated figure are similar. Even so, our main conclusion regarding stellar kinematics and sample environment remains unchanged: the relatively low-density environment of the galaxies in this work does not strongly influence λR.
2.5. Stellar mass, star formation rate, and spin parameter
Figure 6 is the updated version of Figure 9 (Muñoz López et al. 2024). Galaxies with low star formation rates have lower values of angular momentum, which resemble the population of slow rotators at z = 0. Furthermore, the new λR values show with greater significance that low-mass galaxies above the main sequence likely have low stellar angular momentum, as seen in Wang et al. (2020) for z = 0 galaxies. Figure 6 of the original paper showed only tentative hints that this might be the case, whereas the new values provide stronger evidence.
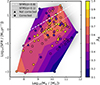 |
Fig. 6. Updated star formation rate as a function of stellar mass colour-coded by λR. The grey-shaded region in the background corresponds to the 3D-HST sample measurement. The dotted and dashed white lines indicate the star formation main sequence for Universe ages of 12.4 Gyr (z = 0.1) and 6.8 Gyr (z = 0.8), respectively, from Eq. (1) of Whitaker et al. (2012). The colour map shows a LOESS-smoothed version of the markers on top. The dots and triangles represent seeing-corrected and uncorrected values, respectively. This figure corresponds to the updated version of Figure 9 in Muñoz López et al. (2024). |
3. Summary of updated results
In conclusion, we summarize the changes of our study when updating the spin parameter λR:
-
Most of the updated stellar angular momentum values decreased because we removed the galaxy’s systematic velocity when computing the spin parameter λR.
-
As a consequence, more galaxies can now be corrected for atmospheric seeing. Compared to 80 out of 106 systems previously, we can now PSF-correct 101 galaxies in total.
-
Our sample contains three slow rotators. Two additional galaxies at z > 0.6 are slow-rotating (Galaxies 51 and 71), which share the main properties of the slow rotators in the local Universe.
-
Our conclusions regarding λR and the environment remain unchanged.
-
The new λR values show greater similarity between intermediate-redshift galaxies and the local population: low-angular-momentum galaxies are found below the star-forming main sequence, and above it for low-mass galaxies.
References
- Cappellari, M. 2016, ARA&A, 54, 597 [Google Scholar]
- Emsellem, E., Cappellari, M., Krajnović, D., et al. 2011, MNRAS, 414, 888 [Google Scholar]
- Graham, M. T., Cappellari, M., Li, H., et al. 2018, MNRAS, 477, 4711 [Google Scholar]
- Muñoz López, C., Krajnović, D., Epinat, B., et al. 2024, A&A, 688, A75 [NASA ADS] [CrossRef] [EDP Sciences] [Google Scholar]
- Wang, B., Cappellari, M., Peng, Y., et al. 2020, MNRAS, 495, 1958 [NASA ADS] [CrossRef] [Google Scholar]
- Whitaker, K. E., van Dokkum, P. G., Brammer, G., et al. 2012, ApJ, 754, L29 [NASA ADS] [CrossRef] [Google Scholar]
© The Authors 2026
 Open Access article, published by EDP Sciences, under the terms of the Creative Commons Attribution License (https://creativecommons.org/licenses/by/4.0), which permits unrestricted use, distribution, and reproduction in any medium, provided the original work is properly cited.
This article is published in open access under the Subscribe to Open model. This email address is being protected from spambots. You need JavaScript enabled to view it. to support open access publication.
All Tables
All Figures
|
Fig. 1. Updated observed stellar angular momentum profile for the sample galaxy for different aperture radii (0.5, 1.0, 1.5, and 2 Re) relative to the effective radius. The values are not seeing-corrected. The colours indicate the galaxy ellipticity ϵ, which is also indicated in each panel. This figure corresponds to the updated version of Figure 4 in Muñoz López et al. (2024). |
| In the text | |
|
Fig. 2. Updated corrections for the spin parameter in the galaxy sample. Both panels (left and right) are colour-coded by the ratio (r) of the galaxy’s angular size to the PSF, given by the major-axis Rmaj and σPSF, respectively. The ratio r is a parameter that quantifies how well-resolved a galaxy is. Left: Generalized Moffat and empirical fn functions as correction indicators from Graham et al. (2018) and their dependence on the observed (measured) stellar spin parameter, the galaxy angular size, and the width of the PSF. The shaded part of the plot indicates the region where the galaxy spin parameter correction is not physical, leading to |
| In the text | |
|
Fig. 3. Updated λR as a function of ellipticity, colour-coded by redshift, for the 106 sample galaxies, with histograms. The circles indicate galaxies where the spin parameter was corrected for atmospheric seeing; the value corresponds to the intrinsic stellar angular momentum ( |
| In the text | |
|
Fig. 4. Updated λR as a function of galaxy ellipticity, colour-coded by redshift, for the three different mass bins indicated in the top part of each panel. The dashed black lines denote the threshold between slow and fast rotators. Uncorrected and corrected λR values are indicated by triangles and circles, respectively. This figure corresponds to the updated version of Figure 7 in Muñoz López et al. (2024). |
| In the text | |
|
Fig. 5. Updated λR − ϵ plane, colour-coded by two different environmental indicators. The background in all panels shows a LOESS-smoothed version of the dots above. Left: η indicator computed using the FoF algorithm for all galaxies detected in groups. Middle: η indicator computed using the FoF algorithm for galaxies detected in groups with ten members or fewer. Right: Density contrast ( |
| In the text | |
|
Fig. 6. Updated star formation rate as a function of stellar mass colour-coded by λR. The grey-shaded region in the background corresponds to the 3D-HST sample measurement. The dotted and dashed white lines indicate the star formation main sequence for Universe ages of 12.4 Gyr (z = 0.1) and 6.8 Gyr (z = 0.8), respectively, from Eq. (1) of Whitaker et al. (2012). The colour map shows a LOESS-smoothed version of the markers on top. The dots and triangles represent seeing-corrected and uncorrected values, respectively. This figure corresponds to the updated version of Figure 9 in Muñoz López et al. (2024). |
| In the text | |
Current usage metrics show cumulative count of Article Views (full-text article views including HTML views, PDF and ePub downloads, according to the available data) and Abstracts Views on Vision4Press platform.
Data correspond to usage on the plateform after 2015. The current usage metrics is available 48-96 hours after online publication and is updated daily on week days.
Initial download of the metrics may take a while.