Fig. 1
Download original image
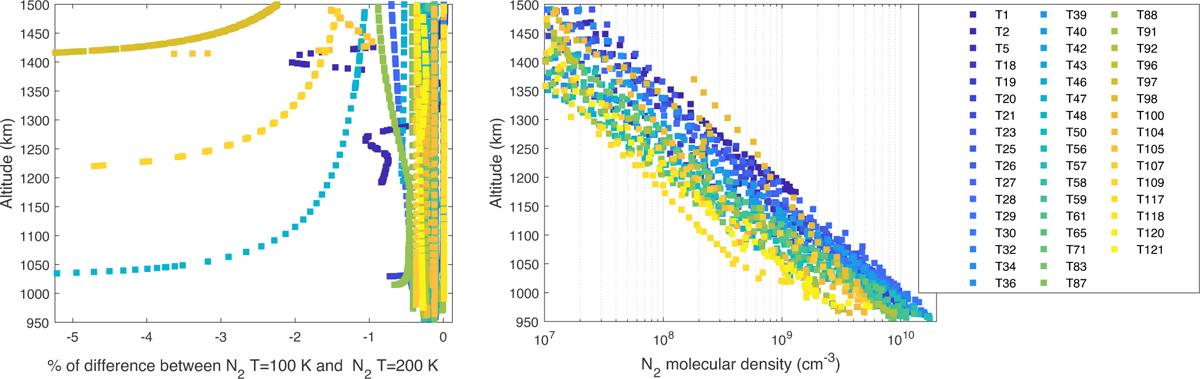
(Left) Percentage of differences between the retrieved N2 densities of flybys from Table A.1 using a temperature profile of 100 and 200 K. With a few exceptions, the difference is below 0.5%. Flybys T96, T97, T105, and T109 reach 30% of difference. (Right) N2 retrieved densities for all flybys for a constant T profile of 150 K. The colours depend on the flyby, and the density points are stacked and averaged.
Current usage metrics show cumulative count of Article Views (full-text article views including HTML views, PDF and ePub downloads, according to the available data) and Abstracts Views on Vision4Press platform.
Data correspond to usage on the plateform after 2015. The current usage metrics is available 48-96 hours after online publication and is updated daily on week days.
Initial download of the metrics may take a while.