Fig. 3
Download original image
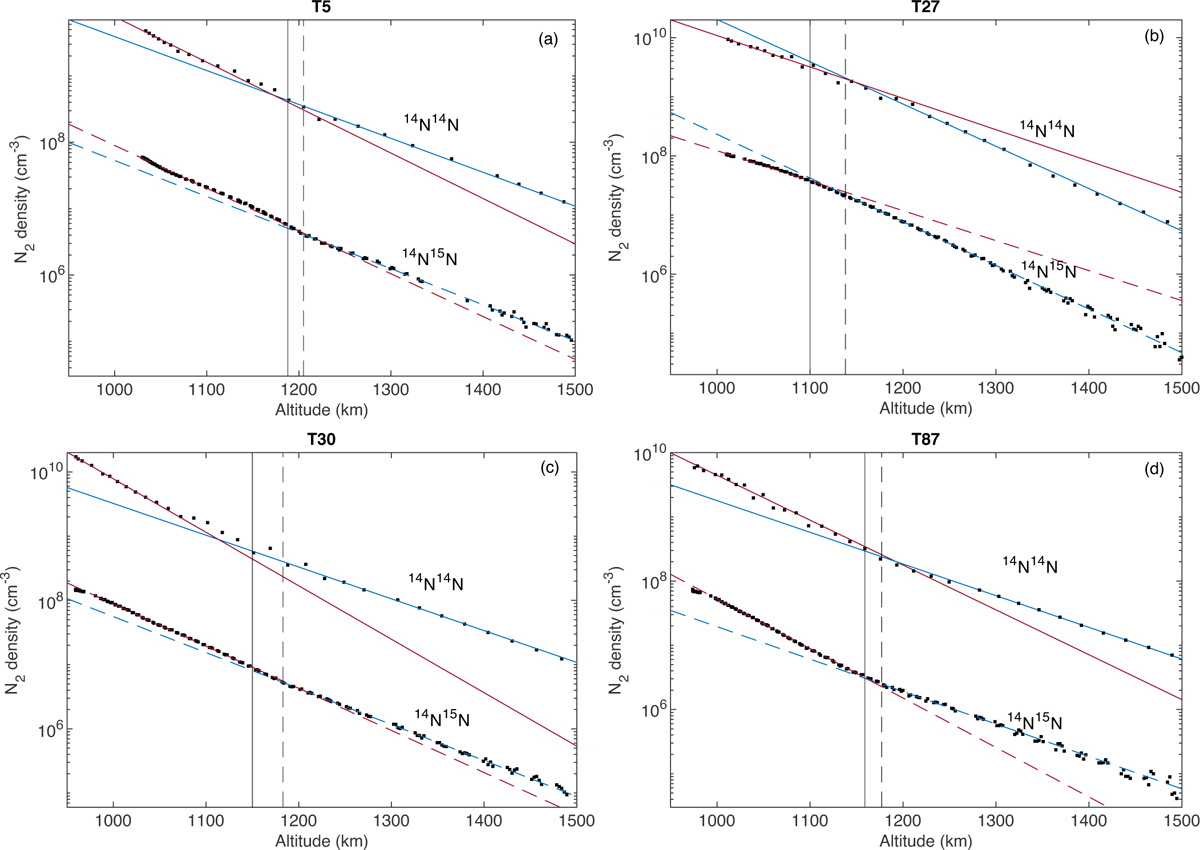
N2 molecular density for flybys T5, T27, T30, and T87. The top data points, fitted with plain lines, are the averaged molecular density of 14N 14N stacked over four data points. The bottom data points, fitted with dashed lines, are for 14N 15N molecular density. In blue and red are the fitted lines using equation 3 at high and low altitude, respectively, for 14N14N (plain) and 14N15N (dashed). The vertical lines are the altitudes below which 14N14N (plain) and 14N15N (dashed) data point cannot be fitted anymore by the blue curve.
Current usage metrics show cumulative count of Article Views (full-text article views including HTML views, PDF and ePub downloads, according to the available data) and Abstracts Views on Vision4Press platform.
Data correspond to usage on the plateform after 2015. The current usage metrics is available 48-96 hours after online publication and is updated daily on week days.
Initial download of the metrics may take a while.