Open Access
Fig. 4
Download original image
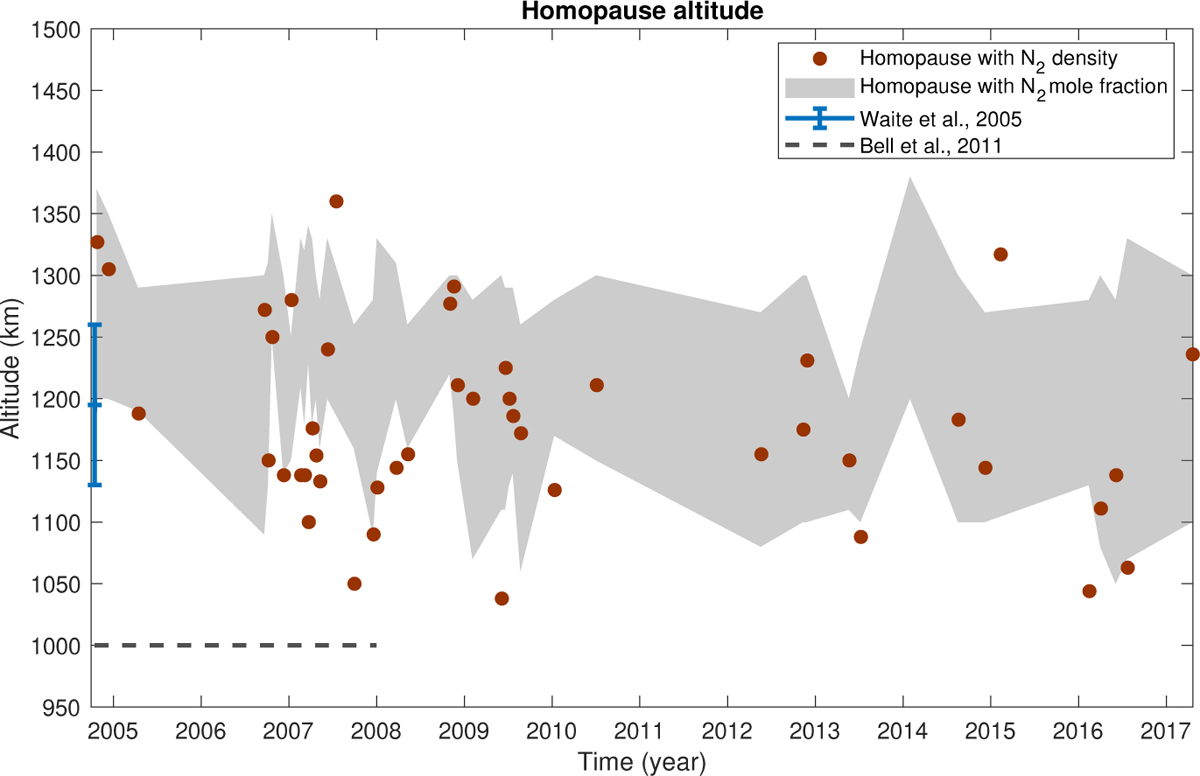
Upper and lower limits of the transition area between the homosphere and the heterosphere for each flyby from the mole fraction (grey) and the molecular density (red) of N2. The results from Waite et al. (2005) are in blue and those from Bell et al. (2011) are represented by the dashed grey line.
Current usage metrics show cumulative count of Article Views (full-text article views including HTML views, PDF and ePub downloads, according to the available data) and Abstracts Views on Vision4Press platform.
Data correspond to usage on the plateform after 2015. The current usage metrics is available 48-96 hours after online publication and is updated daily on week days.
Initial download of the metrics may take a while.