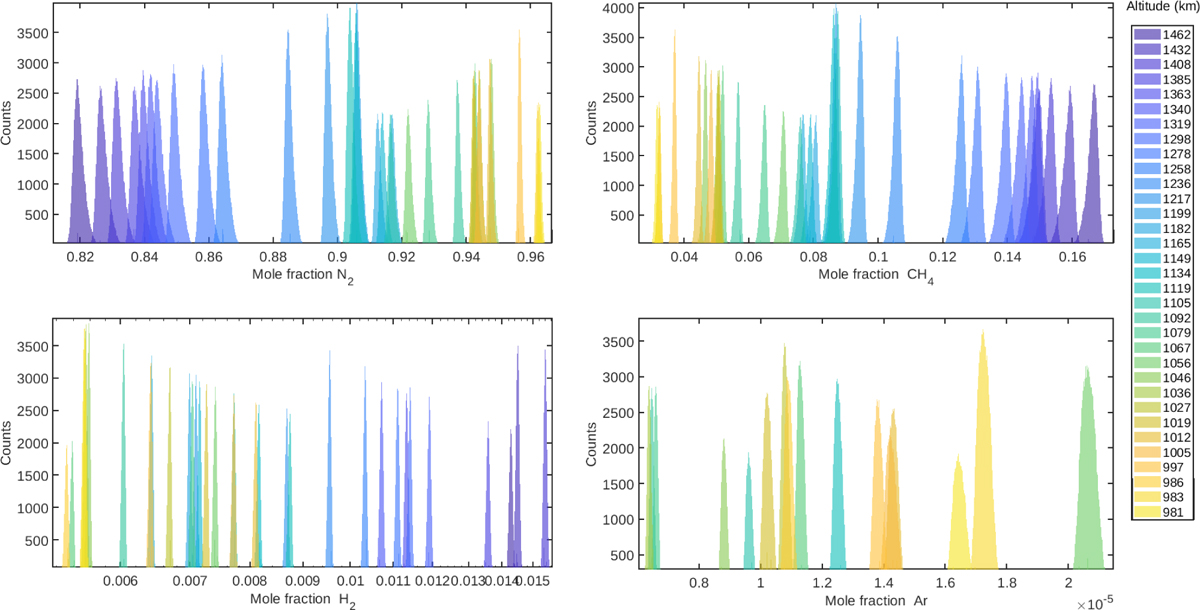
Fig. B.1
Download original image
Distribution of our 100000 Monte Carlo simulation results for T126 for N2,CH4, H2 and Ar. As N2 increases, the dispersion of N2 and CH4 mole fraction decreases and their 1σ error varies from ±12 to 21 × 10−4. For Argon, the dispersion increases with its mole fraction and 1σ varies from ±1 to 3.5 × 10⁻⁷. For H2, 1σ ± 7 × 10⁻⁵. Each colour correspond to an altitude, from 1500 km (dark blue) to 950 km (yellow).
Current usage metrics show cumulative count of Article Views (full-text article views including HTML views, PDF and ePub downloads, according to the available data) and Abstracts Views on Vision4Press platform.
Data correspond to usage on the plateform after 2015. The current usage metrics is available 48-96 hours after online publication and is updated daily on week days.
Initial download of the metrics may take a while.