Open Access
Fig. B.3
Download original image
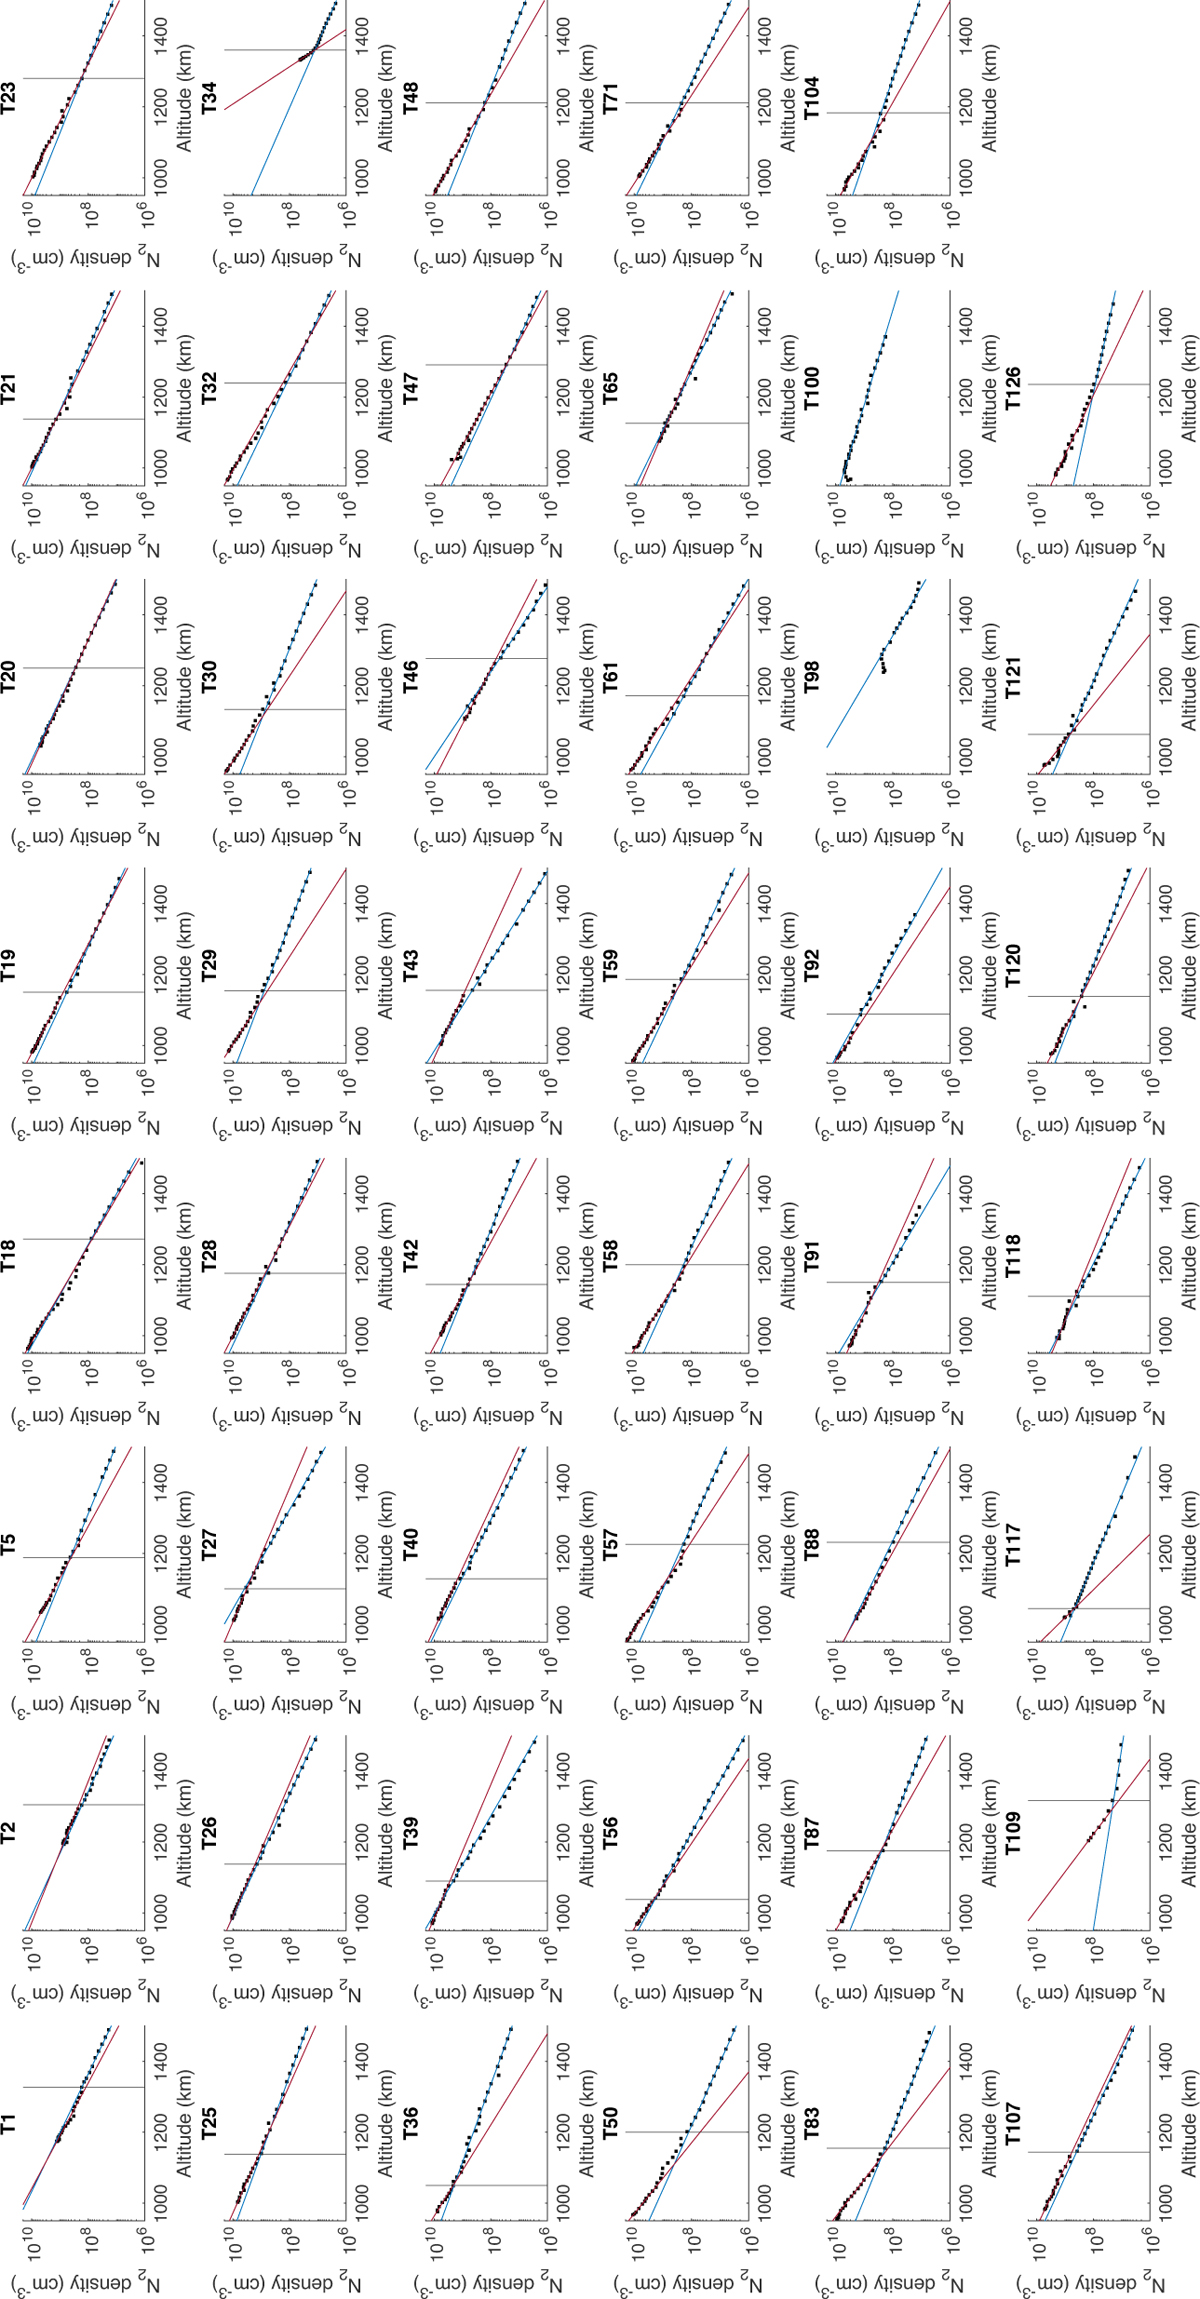
14N14N molecular density profiles for all flyby used in this study, fitted at high altitude (blue line), and low altitude (red line), with the vertical line showing the altitude where the blue line doesn’t fit the data any more.
Current usage metrics show cumulative count of Article Views (full-text article views including HTML views, PDF and ePub downloads, according to the available data) and Abstracts Views on Vision4Press platform.
Data correspond to usage on the plateform after 2015. The current usage metrics is available 48-96 hours after online publication and is updated daily on week days.
Initial download of the metrics may take a while.