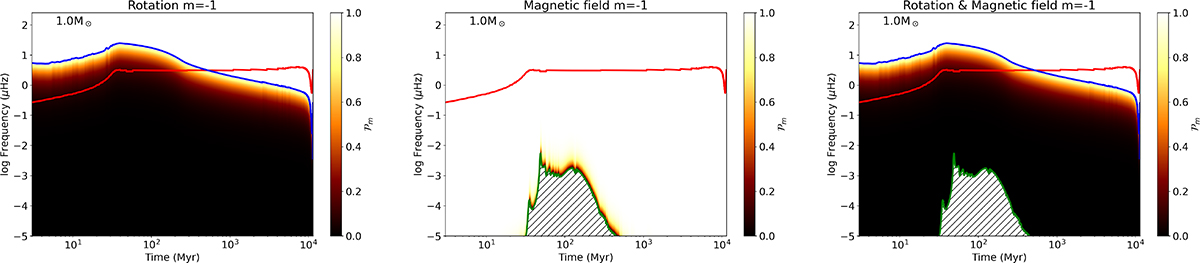
Fig. 4.
Download original image
Colour maps of the transmission function, 𝒫m, from Mathis & de Brye (2012) with m = −1 as a function of frequency and time for a 1 M⊙ star. Left (centre): 𝒫m when only the rotation (toroidal magnetism) is taken into account. Right: Case with the full contribution coming from 𝒫m. White regions show where the angular momentum flux carried by the wave is unaffected by the rotation and magnetic field while black regions indicate where it is. The dashed part of the diagram present the region where the waves are completely trapped vertically and therefore do not propagate. The red line shows the convective turnover frequency as a function of time, which acts as a proxy for the peak of excitation. The blue and the green lines are the inertial frequency (2Ω) and the Alfvén frequency integrated over the upper 5% of the radiative core, respectively.
Current usage metrics show cumulative count of Article Views (full-text article views including HTML views, PDF and ePub downloads, according to the available data) and Abstracts Views on Vision4Press platform.
Data correspond to usage on the plateform after 2015. The current usage metrics is available 48-96 hours after online publication and is updated daily on week days.
Initial download of the metrics may take a while.