Open Access
Fig. 2.
Download original image
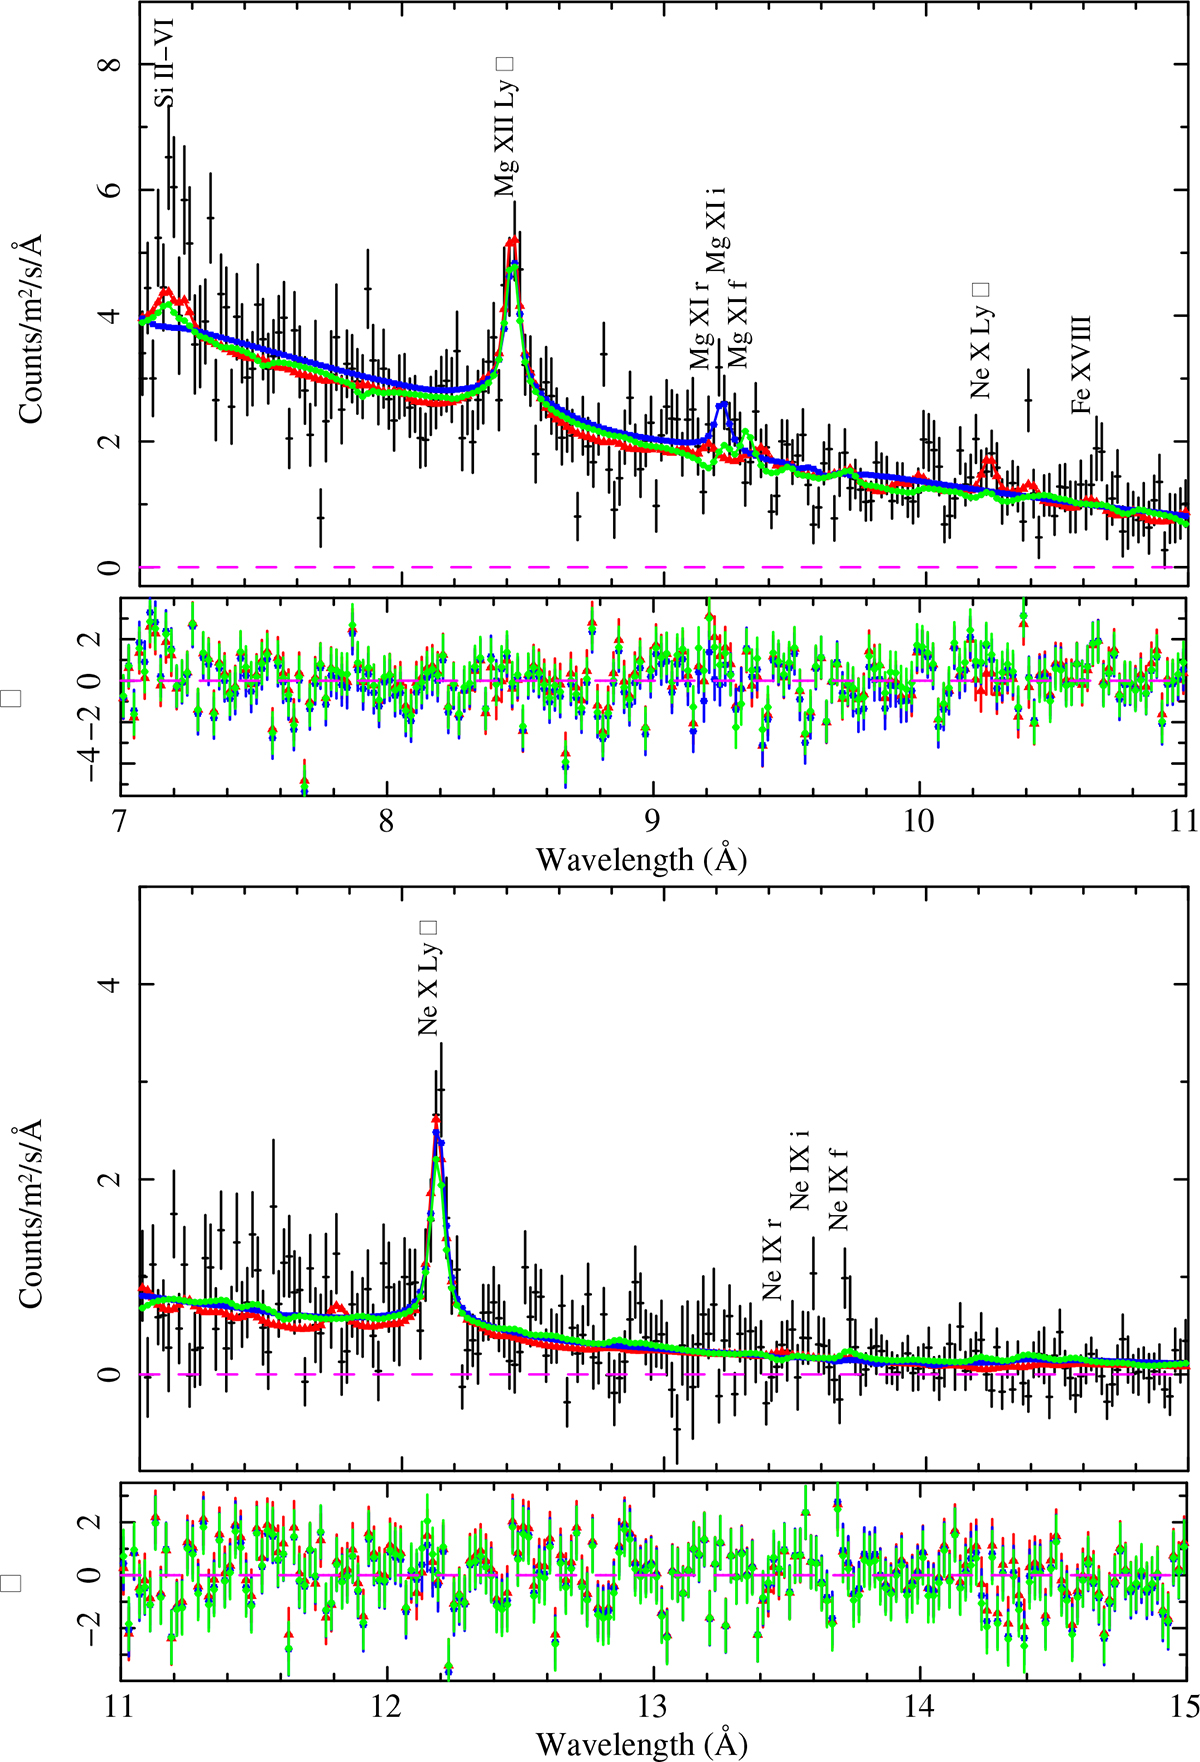
RGS data, photoionisation-dominated model (green circle), collisional-dominated model (red triangle), Gaussian emission lines (blue square), and residuals (expressed in terms of number of standard deviations) for the 0111010101 orbital phase-averaged spectrum.
Current usage metrics show cumulative count of Article Views (full-text article views including HTML views, PDF and ePub downloads, according to the available data) and Abstracts Views on Vision4Press platform.
Data correspond to usage on the plateform after 2015. The current usage metrics is available 48-96 hours after online publication and is updated daily on week days.
Initial download of the metrics may take a while.