| Issue |
A&A
Volume 708, April 2026
|
|
|---|---|---|
| Article Number | A113 | |
| Number of page(s) | 13 | |
| Section | Stellar structure and evolution | |
| DOI | https://doi.org/10.1051/0004-6361/202453628 | |
| Published online | 31 March 2026 | |
High-resolution X-ray spectroscopy of Cen X−3 with XMM-Newton
1
Department of Physics, Systems Engineering and Signal Theory, University of Alicante, 03080 Alicante, Spain
2
University Institute of Physics Applied to Sciences and Technologies, University of Alicante, 03080 Alicante, Spain
★ Corresponding author: This email address is being protected from spambots. You need JavaScript enabled to view it.
Received:
30
December
2024
Accepted:
25
January
2026
Abstract
Aims. The spectral analysis of two XMM-Newton observations of the high-mass X-ray binary system Cen X−3 is presented. In particular, it is focused on the eclipse and out-of-eclipse spectra in order to compare the properties of the environment around the compact object.
Methods. The high-resolution spectra obtained from the reflection grating spectrometer on board XMM-Newton were analysed, with a focus on studying eclipse and out-of-eclipse spectra separately. Several continuum models were explored in SPEX, for which we studied the properties of emitting and absorbing matter depending on the emission and absorption lines identified in the spectra.
Results. It was found that the X-ray continuum is heavily absorbed by a neutral gas and photoionised matter. Emission lines from Si V, Mg XII, Mg XI, and Ne X were detected in the eclipse spectrum; in particular, H-like lines of Mg and Ne with a significance of ≳5σ in the eclipse spectrum and ∼3σ in the out-of-eclipse spectrum. However, in the out-of-eclipse spectrum any absorption lines were detected with a significance of less than 2σ. RGS light curve showed dips in the out-of-eclipse spectrum that are not due to an increase in the column absorption but that may be produced by instabilities in the accretion stream. On the other hand, the level of counts above 20 Å was compatible with the X-ray background. A simple local continuum model was used to describe the He-like triplet of Ne and the derived values of ℛ and 𝒢 ratio parameters pointed out that the UV photospheric field should be important at the line production site and an electron density greater than 1012 cm−3. As a consequence, a hybrid plasma may be present in the binary system.
Key words: binaries: eclipsing / circumstellar matter / stars: neutron / pulsars: individual: Cen X-3
© The Authors 2026
 Open Access article, published by EDP Sciences, under the terms of the Creative Commons Attribution License (https://creativecommons.org/licenses/by/4.0), which permits unrestricted use, distribution, and reproduction in any medium, provided the original work is properly cited.
This article is published in open access under the Subscribe to Open model. This email address is being protected from spambots. You need JavaScript enabled to view it. to support open access publication.
1. Introduction
Cen X−3 is a high-mass X-ray binary (HMXB) formed by a neutron star (NS) orbiting the O6-8 III counterpart V779 Cen (Hutchings et al. 1979). The eclipsing nature of the system was discovered by Schreier et al. (1972). Eclipse duration is around 22% of the orbital period. The high X-ray luminosity (White et al. 1983) compared with other HMXBs, such as Vela X−1 or 4U 1538−52, is explained via a combination of stellar wind accretion plus an accretion disc fed by Roche-lobe overflow (Tjemkes et al. 1986). The accretion produces copious X-ray emission that photo-ionises the circumstellar wind, producing emission lines due to recombination in highly ionised plasma (Day & Stevens 1993). During the eclipse, the direct emission from the NS is blocked by the donor star and the scattered emission will be enhanced assuming that the ionised plasma is extended at larger distances from the compact object. Exploring the eclipse spectrum using high-resolution X-ray spectroscopy provides a powerful tool with which to study the stellar wind characteristics. Ebisawa et al. (1996) obtained an observation, covering the entire eclipse taken with the ASCA satellite. They reported the presence of emission lines from hydrogenic ions of Ne, Mg, Si, S, and Fe and studied the variation in the features at different orbital phases. On the other hand, Wojdowski et al. (2003) also studied an eclipse observation taken with the Chandra observatory. They detected hydrogen-like emission lines such as Si XIV, Mg XII, or S XVI, and helium-like triplets, such as Mg XI, S XV, Si XIII, or Fe XXV, although only the two last ones were clearly resolved (see also Iaria et al. 2005).
In this work we report on the analysis of both emission and absorption lines in the spectra of Cen X−3 obtained with the XMM-Newton Reflection Grating Spectrometer (RGS; den Herder et al. 2001). A detailed analysis of the European Photon Imaging Camera (EPIC) spectra was presented in Sanjurjo-Ferrín et al. (2021, Paper I). Prominent emission lines from highly ionised Fe (Fe XXV He-like and Fe XXVI H-like Ly α) were present along with Fe Kα fluorescence from near neutral Fe. The model used to describe the broadband spectrum was semi-phenomenological and composed of a blackbody plus a power law, while the emission lines were modelled using Gaussians. This allowed the line changes to be tracked throughout the orbital phase. Here, we are interested in the high-resolution spectra provided by the RGS instrument, with the aim of testing self-consistent theoretical plasma models using the rich emission line spectrum below 2 keV.
The paper is organised as follows. In Sect. 2 the observations and data reduction are presented. The models and the results of the analysis are presented in Sect. 3. The discussion and the comparison with previous work are given in Sect. 4 and conclusions are reported in Sect. 5.
2. Observations and data reduction
Two archival observations of Cen X−3 taken with XMM-Newton (see Table 1) were used. The data were reduced with the XMM-Newton Science Analysis System (SAS), version 16.0.0.
XMM-Newton RGS observations used in this paper.
The RGS data were processed with the SAS task rgsproc. Light curves for the background in CCD9 were obtained following the XMM-SAS procedure1 in order to remove soft proton flares and spurious events. Good time intervals (GTIs) were created for filtering periods of high background. Subsequently, we reprocessed the data again with rgsproc by filtering them with the GTI for background screening. Response matrices and spectra for the two observations were also extracted. The final net exposure times are reported in Table 1. After verifying that the RGS 1 and RGS 2 were compatible with each other across the whole wavelength range, fluxed spectra for both RGS instruments were obtained and stacked with the SPEX2 task RGS_fluxcombine according to the procedure described by Kaastra et al. (2011). Useful data were obtained for the interval (7–38) Å. Both first-order spectra were flux-combined into an RGS spectrum. We created the exposure-corrected and background-subtracted light curves using the SAS task rgslccorr. Figure 1 shows the count rate of the combined RGS data in different wavelength bands and the corresponding hardness ratio as a function of time. Observation 0111010101, taken at the source low state (left) clearly shows the eclipse egress, more noticeable at the lower energies. The ratio (6–12) Å/(12–24) Å does not show any noticeable change, although the uncertainties in the eclipse light curve are high. The second observation, 0400550201, taken during a high state and totally out of eclipse (right), is more constant but shows a flux decrease at the end. In order to shed light on the changes in the reprocessing environment of the binary system, we performed time-resolved spectroscopy during the eclipse ([0–32] ks), eclipse-egress ([32–52] ks), and egress for the observation ID 0111010101. On the other hand, we extracted the high count rate (HCR; [0–56] ks) and low count rate (LCR; [56–80] ks) spectra, respectively, for the observation ID 0400550201. We present our results in Sect. 3.3.
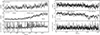 |
Fig. 1. Light curves and hardness ratio of the first (0111010101) low state observation (left) and the second (0400550201) high state (right) observation with RGS. Intervals with high background have already been taken out. |
3. Spectral analysis
The spectral analysis was carried out using the SPEX software version 3.08.01 (Kaastra et al. 1996). The interstellar abundances were scaled to the recommended proto-solar or Solar System values of Lodders & Palme (2009). As the spectra were created with RGS_fluxcombine, the natural Poissonian fluctuations on the spectra as a function of detector pixel are distributed over the wavelength bin coinciding most with the detector pixel and its neighbours. Due to this tempering of the Poissonian fluctuations, χ2 values will be lower than C statistics for the best spectral fit. Therefore, we used the χ2 statistic and adopted 1σ errors when fitting the combined RGS spectrum. We assumed the classical distance to the source to be ∼8 kpc (Krzeminski 1974), although Thompson & Rothschild (2009) derived a marginally inconsistent distance of 5.7 ± 1.5 kpc when studying the X-ray halo of this object. This assumption is rather consistent with the upper limit of the distance to this source derived from Gaia3 by using the parallax measure, the source’s G-band magnitude, and BP−RP colour  kpc, called by Bailer-Jones et al. (2021) the ‘photo-geometric’ distance. Spectra were also re-binned by a factor of two, i.e. about one third the full width at half maximum (FWHM; the first-order RGS spectra provide a resolution of (0.06–0.07) Å). This gives the optimal binning for the RGS and a bin size of about 0.02 Å.
From the XMM-Newton/EPIC-PN light curve (Naik & Paul 2012, Paper I), the orbital phase range ϕ = ( + 0.00 − 0.37) was derived for the first observation. Using the ephemeris of Cen X−3 obtained by Falanga et al. (2015) and the previous mid-eclipse time, we estimated the orbital phase range ϕ = (0.35 − 0.80) for the second one. Therefore, the spectrum covering the eclipse could be compared with the spectrum out-of-eclipse. First, it was noticed that the spectra above 20 Å show the same level of counts for the source and for the X-ray background. Therefore, the continuum emission was defined using a shorter wavelength range (7–20) Å than that provided by the instruments.
Cen X-3 is a complex system with different X-ray sources, such as the accretion disc, the hotspots on the NS surface, or the scattered photons in the strong stellar wind. Consequently, several continuum models were tested for a reasonable description of the averaged spectra modified by neutral gas absorption. Then, the observation ID 0111010101 was divided into three different intervals – eclipse, eclipse-egress, and egress – described in Fig. 1 (left). The fit results are discussed in Sect. 3.3.1. On the other hand, the observation ID 0400550201 was divided into two intervals – HCR and LCR – described in Fig. 1 (right). The fit results are discussed in Sect. 3.3.2. A separate spectral analysis was also performed of each dip detected as well as all of the out-of-dip regions between them marked in Fig. 9.
3.1. The 0111010101 orbital phase-averaged spectrum
During the eclipse phases, the direct component from the NS is blocked by the counterpart. Thus, X-ray continuum emission is lower than in out-of-eclipse phases and the emission lines stand out clearly above the continuum level. The strong X-ray radiation from the NS ionises the stellar wind, producing a plasma with a high ionisation parameter (see Wojdowski et al. 2003; Iaria et al. 2005, for instance). Therefore, the circumstellar gas is expected to be photoionisation-dominated and models such as pion in SPEX (Mehdipour et al. 2016) or photemis in XSPEC are tested. A single absorbed power law (χred2 ∼ 721/396) or a single absorbed black-body (χred2 ∼ 746/396) described the continuum reasonably. Then, a photoionised plasma in emission was added to the continuum to describe the emission lines. The ionisation parameter, log ξ (W m), was limited to between 1 and 4, the covering fraction was set to zero, i.e. a pure emission line model, and the solid angle, Ω, was set to 1 (a full shell of 4π steradians). A low-energy and high-energy exponential cut-off of the power-law component were applied by using two etau components, while the emission from the pion component was not attenuated by these two components.
The interstellar absorption was described with the hot model in SPEX, which calculates the transmission of a collisionally ionised equilibrium plasma (de Plaa et al. 2004; Steenbrugge et al. 2005). For a given temperature and set of abundances, the model calculates the ionisation balance and determines all the ionic column densities by scaling to the prescribed total hydrogen column density. We fixed the temperature to the minimum value in SPEX (i.e. 0.001 eV) to mimic the neutral interstellar gas and the hydrogen column density to the Galactic absorption toward the direction of Cen X−3, NH = 1.16 × 1026 m−2 (Willingale et al. 2013). We also modelled the intrinsic absorption due to the stellar wind and/or other material around the compact object with a second hot component. The best-fit parameters of the photoionisation dominated model are tabulated in Table 2.
Phase-averaged spectral parameters for the 0111010101 observation.
As a intrinsic absorber, we used either a xabs absorption component or a warm absorber instead of the second hot model. The apparent absorption features in the spectrum are not well described and do not improve the previous fit. We also tested if the eclipsed spectrum is better described by a plasma in a collisional-ionisation equilibrium state. Therefore, the same continuum components were used but changing the pion component with a cie component in SPEX. This model provides a better description of the data (χ2/d.o.f. = 518/391) compared to the previous one. No combination model of a collisionally ionised component and a photoionisation component improves these fits.
To parametrise the strongest emission lines, the absorbed power law was also used and the collisionally ionised component or photoionisation component was now substituted with different Gaussian line profiles (χ2/d.o.f. = 550/394). The FWHM ( ) of the Gaussian lines was fixed at 0.005 Å and the derived line flux was compared to that obtained in the previous models. The strongest features at 8.424 Å, (identified as Mg XII, which is actually a doublet) and at 12.140 Å (identified as Ne X, which is also a doublet) have a probability of 1.0 × 10⁻¹⁰ and 2.3 × 10⁻⁷, respectively. The faintest emission line at 9.222 Å (identified as Mg XI, therefore, located in the He-like triplet of this element and unresolved properly in this eclipse spectrum) has a probability of 0.015. Mg XII Ly α and Ne X Ly α are highly significant at > 3σ and the wavelengths of the centroid of the lines are equivalent to the reference values. The equivalent width (EW) is the ratio Fℓ/Fc, where Fℓ is the photon flux of the line in units of photons per second and Fc is the flux per unit of energy of the continuum at the energy of the line in units of photons per second per kilo-electronvolt. The EWs for Mg XII Ly α and for Ne X Ly α are ∼19 eV and ∼61 eV, respectively, consistent with the values found by Sanjurjo-Ferrín et al. (2021, see their Fig. 10). The other emission lines listed in Table 3 are detected at ≲3σ. Figure 2 shows the best fit of the eclipse averaged spectrum by the three models. The best-fit values of the emission lines for the three models are shown in Table 3.
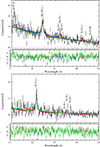 |
Fig. 2. RGS data, photoionisation-dominated model (green circle), collisional-dominated model (red triangle), Gaussian emission lines (blue square), and residuals (expressed in terms of number of standard deviations) for the 0111010101 orbital phase-averaged spectrum. |
Parameters of the emission lines according to the fit results from the three models.
Photoexcitation could play a role in photoionisation equilibrium plasma (pion) when multiple photons with the right energy excite the electrons to the resonant level. This process enhances the resonance line and modifies the gas distribution (Amato et al. 2021). Resonance line scattering can also enhance the resonant (r) component, making it stronger than the inter-combination (i) or forbidden (f) components in the He-like triplet lines. This phenomenon was reported by Wojdowski et al. (2003) for this source, observed during an eclipse, and represents a plausible mechanism for increasing the flux of the r line. Nevertheless, it should be noted that the He-like emission lines of Mg XI and Ne IX cannot be well defined by the models and prevent us from estimating any ratios.
For recombination, as well as emission from thin collisionally ionised plasmas, the two Ly α components are emitted in proportion to their statistical weights, i.e. the flux ratio Ly α1/Ly α2 = 2 and widths of both components are equal (Wojdowski et al. 2003). For Mg XII Ly α, the X-ray velocity broadening is about 240 km/s in the pion model, which is slightly broader than in the cie model, 180 km/s. On the other hand, for Ne X Ly α, the emission line broadening is 100 km/s and 80 km/s, respectively. Using two Gaussians to describe the Mg Ly α line produced a FWHM consistent with zero in both components.
Taking into account that the hydrogen-like features detected in the eclipse spectrum peak at different temperatures, here we tested if a pure collisional-ionisation equilibrium plasma provides a better description of the data. Therefore, the spectrum was modelled by emission from two CIE models absorbed by neutral gas. One set of abundances, which was free to vary along with the emission measures and temperatures, was adopted. The ion temperature was coupled to the electron temperature as well. The free parameters for the fit are listed in Table 4, together with the statistical 1σ uncertainties. The X-ray flux was estimated in the energy range of 0.83–1.77 keV. This model gives a χ2/d.o.f. = 517/391 and is equivalent to the absorbed power law and cie description. In Fig. 3 we plot the eclipse spectrum of Cen X−3 along with the model. Emission lines from Ne, Mg, and Si ions are clearly present that are stronger than in the out-of-eclipse, where these emission lines cannot be distinguished from the X-ray continuum without doubts (see Sect. 3.2).
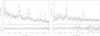 |
Fig. 3. RGS data, model (two cie components), and relative residuals for the 0111010101 orbital phase-averaged spectrum. |
Spectral fit parameters to the 0111010101 orbital phase-averaged and phase-resolved spectra.
Thawing abundances of the elements did not produce a significant improvement of the fit. The slab model was used to identify other absorbing ions present in the plasma from the line list available in SPEX version 2.0 such as Mg IX, Ni XXIV, Ni XXII, Fe XXIV, Fe XXIII, or Si V, but the fit did not improve significantly. Changing the electron density of the plasma or the micro-turbulent velocity for line broadening did not improve the description of the data either.
The description of the averaged spectrum with two cie components fits the emission lines of Ne X (12.134 Å), Fe XVIII (10.627 Å), Ne X (10.240 Å), Mg XII (8.421 Å), and Si II–V (7.126 Å) well. If present, the He-like emission lines of Ne IX (13.447 Å) and Mg XI (9.232 Å) were too blended to allow the forbidden line and inter-combination line to be quantitatively separated and could not be resolved in the eclipse by RGS. Assuming that the X-ray emission of the NS is nearly completely blocked by the giant counterpart, each cie could explain the two different circumsource X-ray emission contributions due to the strong stellar wind (cie2) and from matter around the compact object, i.e. an accretion disc or another structure material close to the NS (cie1). The temperature of cie2 (stellar wind) is  keV, while that of cie1 is much hotter,
  keV. Simultaneous XMM/EPIC spectra detected the presence of the Fe Kα at 6.4 keV, Fe XXV at 6.7 keV, and Fe XXVI at 6.97 keV (Naik & Paul 2012, Paper I). These lines were clearly observed during the eclipse, eclipse-egress, and egress periods. Therefore, the ionisation state is expected to be ξ ∼ 103.4 erg cm s−1 just to detect the helium-like iron line (Ebisawa et al. 1996). Concurrently, to produce Fe Kα emission line the ionisation parameter should be ξ ≲ 102 erg cm s−1 and the silicon line intensity ratio [Si XIII/Si XIV] suggests an ionisation parameter in the interval of [102.1−102.4] erg cm s−1 (Paper I). This implies that, during the XMM-Newton observation, the stellar wind had different levels of ionisation and that the emission sites are probably located in different regions.
3.2. The 0400550201 orbital phase-averaged spectrum
In this orbital phase range, we expect to see the direct emission from the NS surface and a complex scattered emission due to high-energy electrons and/or the circumsource matter around the compact object. We adopted the same set of abundances derived in the eclipse spectrum. The line-of-sight Galactic absorption towards Cen X−3 was frozen using a cold collisionally ionised component, hot in SPEX. Another intrinsic absorption component was added due to any circumsource matter around the pulsar. In all cases, a single continuum component, such as a power law, Comptonisation, blackbody, or modified blackbody, does not give an acceptable fit. Then, several double- or triple-component continuum models were tested. A combination of a power law and a blackbody components gives χ2/d.o.f. = 1625/646. According to this result, the photon index, Γ, of the spectrum is ∼ − 0.7, the emitting region is at a blackbody temperature of ∼0.2 keV, and the blackbody radius was found to be ∼110 km, which is inconsistent with an entire NS surface emission. Replacing the blackbody with an inverse Comptonisation of soft photons in a hot plasma (comt) model led to the worst results (χ2/d.o.f. = 1814/645). In this case, the photon index, Γ, of the spectrum is ∼2.2 and the plasma temperature, t1, is ∼900 keV, larger than the upper limit at which this model could be applied, and other processes such as pair production should be taken into account in modelling the emitted radiation (Hua & Titarchuk 1995).
Fitting two or more cie components did not describe the out-of-eclipse spectrum satisfactorily. Next we tried a continuum component modelled with a power law (direct emission from the NS) and a cie component absorbed by photoionised gas close to the NS (xabs1), partially covered photoionised gas far away from the X-ray source (xabs2), and interstellar medium absorption (hot). The fit provides χ2/d.o.f. = 1359/643 (d.o.f. means degrees of freedom), which is poor. The power-law component was changed by a modified blackbody, with χ2/d.o.f. = 1210/641 being obtained. Adding a new component did not produce any significant improvement.
For this observation, simultaneous XMM/EPIC spectra detected the presence of the Fe Kα at ∼6.4 keV, Fe XXV at 6.7 keV, and Fe XXVI at 6.97 keV (Paper I), implying that the stellar wind required an ionisation parameter of ξ ∼ 103.4 erg cm s−1 (Ebisawa et al. 1996). This spectrum may have both emission and absorption features superimposed on the X-ray continuum that was described by a power law plus Comptonisation components. The emission lines were described by two pion components defined in the same way as in Sect. 3.1. Although the pion model is capable of modelling both of them, for the absorbing gas a xabs or slab model was used in order to save substantial computational time. In this case, photons from both Comptonisation and power-law components are the photo-ionising source of the pion emission components and screened by the absorber component as well as the galactic absorption before reaching the detector. The spectrum is not well described with χ2/d.o.f. = 1519/639.
Finally, the spectral continuum is described by two absorbed power laws plus a broad Gaussian component for fitting the significant deviations around 12 Å. This fit provides a reasonable description of the continuum X-ray emission with χ2/d.o.f. = 1112/642. The free parameters for the best fit are listed in Table 5. The X-ray flux is estimated in the energy range of 0.62–1.77 keV. The corresponding spectrum, continuum model, and residuals are presented in Fig. 4. From the residuals it can be seen that several emission lines are detected at 3σ but the absorption features, if present, cannot be detected significantly (see dashed lines in Fig. 4, bottom panel). Therefore, the continuum parameters were fixed and the prominent helium-like lines (Mg XI and Ne IX) and hydrogen-like lines (Mg XII and Ne X) were fitted with Gaussians to obtain their properties. The width of the lines was fixed to 0.005 Å, except for the He-like Ne line, which was a free parameter in the fit. The EW for Mg XII Ly α is ∼5.8 eV but the centre of the line is blueshifted with respect to the reference position. On the other hand, the high level of the continuum around 12 Å prevented us from detecting the Ne X Ly α line. The He-like Mg is not well resolved in the out-of-eclipse averaged spectrum but the centre of the Gaussian profile points out to a dominant inter-combination line compared to the resonance and forbidden components. Sanjurjo-Ferrín et al. (2021) report the detection of the He-like Mg and a strong inter-combination line in the Chandra observation of this source (see their Fig. 12). All the best-fit values of the emission features are reported in Table 6.
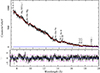 |
Fig. 4. RGS data, continuum model, and residuals (in terms of number of standard deviations) for the 0400550201 orbital phase-averaged spectrum. The dashed lines indicate possible emission or absorption lines detected at the 3σ level. |
He-like and H-like emission lines detected at the 3σ level.
A visual inspection of the residuals suggests the presence of an absorption feature around 9.4 Å, consistent with the location of the Be-like Mg IX Kα at 9.378 Å (Grinberg et al. 2017), and could be affected by the He-like Mg XI triplet that is not resolved or detected by RGS. Under astrophysical conditions, Mehdipour et al. (2015) showed that He-like triplet lines of a given element can be affected by absorption from Li-like ions in the same medium. Although they discussed this effect in the cases of iron and oxygen in both CIE and PIE plasmas, it could be extended to other elements. However, the simultaneous presence of the H-like and He-like iron, which requires a high parameter of ionisation, indicates that this absorption may be due to the He-like Mg XI Kα or an overlap with Ne IX rather than Mg IX. Moreover, the line significance is ≲3σ and the inclusion of a slab component did not improve the fit significantly, therefore, this component was not used further.
It is also complicated to distinguish other emission and absorption lines present in the out-of-eclipse from the X-ray continuum emission at a 3σ detection level. Apparently, the spectrum also shows the neutral absorption edges of neon and iron. Near the Ne I edge at 14.3 Å, two weak absorption features due to mildly ionised Ne II–III could be visible too. The iron L2 and L3 edges are located at 17.2 and 17.5 Å. Another weak emission line at ∼19.0 Å, presumably due to O VIIIα, could also be present.
3.3. He-like triplet of Ne
The average spectrum shows evidence of the unresolved triplet of Ne IX where the forbidden line is nearly suppressed. For a high-density plasma, there is an escape channel for the first excited level, the upper level of the forbidden line (f), by means of collisions. In this case, it is easy to depopulate this state in favour of the upper levels of the inter-combination line (i), implying a reduction in the ratio ℛ = f/i. Nevertheless, the real reason for the low f/i ratio in the spectrum of O stars and B stars is the strong ultraviolet (UV) radiation field. In this case, the ion absorbs an UV photon, depopulating the forbidden line in favour of the inter-combination line (Porquet et al. 2001). Therefore, in order to estimate line parameters, a local continuum was fitted around the Ne IX He-like triplet at ∼13.5 Å, with delta line components being added to model this complex feature (Fig. 5). The parameters are given in Table 7.
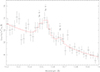 |
Fig. 5. Ne IX triplet with best-fit model. Resonance (r), inter-combination (i), and forbidden (f) components are indicated at observed wavelengths. |
Neon He-like triplet in the out-of-eclipse and HCR spectra.
Using the values quoted in Table 7,  was obtained, with an upper limit of ℛobs < 0.7. This shows that the UV photospheric field should be important at the line production site according to Porquet & Dubau (2000). Since the intensity of the UV radiation decreases outwards in proportion to the dilution factor, i.e. W(r) = [1−(1−(R★/r)2)(1/2)]/2 (Mewe & Schrijver 1978), the observed f/i ratio allowed us to estimate the radial location of the Ne He-like triplet (e.g. see Fig. 4 in Raassen et al. 2008). The upper limit value for formation radius corresponds to ≲8 stellar radii, and the lower limit should be ≳1.5 stellar radii, derived from several studies of the hot plasma for O stars (e.g. see Waldron & Cassinelli 2001; Leutenegger et al. 2006). On the other hand, when the radiation field is the dominant effect ℛ becomes a function of the ionisation fraction, electron density, ne, and electron temperature, Te. Therefore, assuming the peak Ne IX temperature of Te ∼ 2 MK and Porquet & Dubau (2000) calculated values (see their Fig. 8) for f/i ratios, the electron density should be ≳1012 cm−3, which is supported by the observed ratio, 𝒢obs = (f + i)/r = 2.5 ± 2.4 (see Fig. 7 in Porquet & Dubau 2000). Thus, these results point to a hybrid plasma in which the effect of collisional plasma is non-negligible and probably located inside the Roche lobe radius of Cen X−3 (Paper I).
Unfortunately, uncertainties of ℛobs and 𝒢obs are quite large and no other He-like lines were resolved in either the RGS spectrum or the simultaneous EPIC spectra to confirm this argument. On the other hand, thanks to the high-energy resolution of Chandra, Iaria et al. (2005) resolved the He-like Fe XXV and derived ratios of ℛobs = 0.7 ± 0.4 and  , compatible with the XMM-Newton values in this work. They also noted that the H-like Fe XXVI was not detected so the stellar wind had a lower ionisation parameter than in both ASCA (Ebisawa et al. 1996) and XMM-Newton (Paper I) observations. More recently, Sanjurjo-Ferrín et al. (2024) studied a target of opportunity (ToO) Chandra observation during orbital phase (0.13–0.59). They reported the detection of some He-like triplet lines in the spectra of Cen X−3 and could determine the parameters, ℛobs and 𝒢obs, of the Mg XI and Si XIII ions (see Table 6 in Sanjurjo-Ferrín et al. 2024), which are located in the RGS energy range. Their results are broadly consistent with that obtained in this work, when taking the associated errors into account.
3.4. Orbital phase-resolved spectroscopy
To analyse spectral variations, the entire light curves were divided into different periods from which corresponding spectra were extracted (see Fig. 1): eclipse period, eclipse-egress, and egress for the first observation (ObsID 0111010101) and HCR and LCR for the second one (ObsID 0400550201). The source spectrum for each one was extracted from RGS, as is described in Sect. 2. The same model employed for analysing the average spectra was used in order to study the parameter variations (see Tables 4 and 5). In Figs. 6 and 8, RGS orbital phase-resolved spectra are shown.
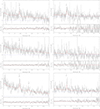 |
Fig. 6. RGS data, model, and relative residuals for the orbital phase-resolved spectra. From top to bottom: Eclipse, eclipse-egress, and egress in the 0111010101 ID observation. |
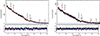 |
Fig. 8. RGS data, model, and residuals in terms of standard deviations for the high (left panels) and low (right panels) count rate spectra in the 0400550201 ID observation. |
3.4.1. ObsID 0111010101
Due to the limited counts in the spectrum during the eclipse orbital phase, the orbital phase-resolved spectrum exhibits substantial uncertainties in the model parameters, and as a consequence the majority of these parameters remain consistent between them within the error range. Nevertheless, a clear progressive increase in both the emission measure and flux of component cie1 can be derived. Meanwhile these parameters of component cie2 seem to be constant from the beginning to the middle of the observation and then to increase to the egress phase. The evolution of the hydrogen column density of the absorbing material reflects that the amount of surrounding material increases in the line of sight towards the NS as it emerges from the eclipse. An enhancement is present from eclipse to egress. On the other hand, the NH remains larger than the Galactic absorption value throughout the observation. This indicates the presence of extra matter: either stellar wind, a disc around the compact object, or both. An apparent linear correlation between the column density and unabsorbed flux was found (see Fig. 7).
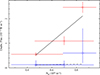 |
Fig. 7. Correlation of the unabsorbed flux (red square corresponds to Cie1 and blue circle corresponds to Cie2) versus the column density, NH. |
Hydrogenic-like lines of Mg XII and Ne X seem to be present along the eclipse-egress transition, showing a little variability, but no helium-like lines were clearly detected in the orbital phase-resolved spectra, suggesting that the region where are produced should be in the surroundings of the NS. The emission lines were described by Gaussian components and the resulting line parameters are listed in Table A.1. In the eclipse spectrum, the EWs of these lines are ∼11.7 eV and ∼23.3 eV, in the eclipse-egress spectrum, they are ∼5.9 eV and ∼36.4 eV, and in the egress spectrum, they are ∼34.8 eV and ∼73.5 eV. It should be noted that large uncertainties for the emission line fluxes prevent us from analysing the EW evolution and drawing any strong conclusions. In Fig. 6 time-resolved spectra fits and residuals are shown.
3.4.2. ObsID 0400550201
The behaviour of the source during the out-of-eclipse orbital phase also showed emission changes between the low and high fluxes (relative to the mean). The flux differences between them were statistically significant at one sigma. Assuming that the power-law component, PL1, is related to the direct X-ray emission, and the increase from HCR to LCR in the column density, [NH(LCR)∼1.5 NH(HCR)], the X-ray flux rise could be due to the fall in NH, although an increment in the mass accretion rate cannot be ruled out either. The scatter emission due to the interaction with the stellar wind and/or the accretion disc should be described by the another power-law component, PL2, enhanced by the broad Gaussian component. The power-law (PL2) unabsorbed flux is slightly larger in the HCR state than in the LCR state and the enlargement produced by the Gaussian component is equivalent in the HCR and LCR states, taking the uncertainties into account.
In the HCR spectrum, both the He-like Mg and Ne triplets are detected as a single feature centred on the inter-combination wavelength. The Mg XII Ly α is blueshifted and the Ne X Ly β is redshifted with respect to the reference wavelengths. The line parameters are listed in Table 6. On the contrary, none of these features are present in the LCR spectrum.
Nevertheless, residuals around the He-like Ne IX triplet in the HCR spectrum suggest that this emission line could be separated by its components. A local fit was adopted to obtain line parameters, which are also listed in Table 7. The forbidden to inter-combination line ratio derived from the HCR RGS spectrum for the helium-like neon ion is  and it is totally consistent with the HCR average spectrum value. The forbidden and inter-combination to resonance line ratio derived is 𝒢obs = (f + i)/r = 3.6 and a relative error equivalent to 100%. According to the theoretical wavelength from Kelly (1987) and Dere et al. (2001), the individual velocity shifts derived from the averaged and HCR spectra for resonance lines of 960 km/s and 670 km/s, for inter-combination lines of −200 km/s and −380 km/s, and for forbidden lines of −660 km/s and −220 km/s, respectively.
On the other hand, the evolution of the light curve in the out-of-eclipse observation showed sudden dips in both time-resolved spectra, as can be seen in Fig. 1 (right panel). Therefore, GTIs for defining the dip and non-dip intervals were derived and spectra were extracted from these defined intervals. The duration of the dip events are in the range (200, 1300) s with an accumulated time of ∼7.9 ks for the HCR spectrum and (400, 1100) s with an accumulated time of ∼4.9 ks for the LCR spectrum, as is indicated in Fig. 9. The same component models were applied in order to compare the model parameters with the previous fits (see Table 5). Significant changes in the model parameters were found, showing a complex interaction between the X-ray emitter, stellar wind, and accretion disc or other material distribution around the NS. Dips could be explained by an overall rise in absorption but here the hydrogen column density is found to be  m−2 in the high flux state (smaller than that in the HCR and out-of-dips averaged spectra) and
  m−2 in the low flux state (similar to the value obtained in the LCR and out-of-dips averaged spectra). Therefore, these results suggest that dips can be attributed to a drop in the mass accretion rate. It should be noted that the X-ray emission in the LCR dip events did not need the broad Gaussian component to describe this spectrum. Both dip durations and hardness light curves from the PN instrument showed a similar behaviour as RGS data (e.g. see Figs. 3 and 6 in Sanjurjo-Ferrín et al. 2021, and Fig. 1 in this work). The authors of Paper I concluded that the observed dips were probably due to inevitable instabilities occurring at the inner edge of the disc interacting with the NS magnetosphere.
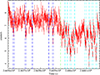 |
Fig. 9. Dips GTIs intervals. The vertical dash-dotted green line indicates the HCR (on the left) and LCR (on the right) time intervals. The vertical dash-dotted dark blue and light blue lines indicate the dips from the HCR and LCR time intervals, respectively. |
4. Discussion
The eclipse spectrum of Cen X−3 has usually been described by absorbed power laws and a variable number of emission (Gaussian) lines in the RGS wavelength range (Ebisawa et al. 1996; Wojdowski et al. 2003), although it was applied to fit a broader wavelength range (1.2–17.7) Å compared to the RGS wavelength band (7.0–15.0) Å. Generally, it is assumed that an X-ray source photo-ionises the strong stellar wind of the giant or supergiant companion where these emission lines are produced. Wojdowski et al. (2003) fitted the eclipse spectrum of Cen X-3 with pure collisionally ionised plasma in the energy range [0.7–10.0] keV. Although this model reproduced most of the observed emission lines and also accounted for all of the continuum emission below ∼4 keV, they rejected this model and adopted a pure photoionised plasma. However, they did not attempt a hybrid scenario of collisional and photoionised plasma. SPEX photoionised plasma and photoionised absorbed models as well as a hybrid collisional and photoionised plasma were used to describe the spectra, but the fits did not describe the observed emission lines well. The most prominent emission lines were the Ly α transitions from the hydrogen-like ions Mg and Ne, which can be produced in a collisional plasma. A combination of two absorbed collisional ionisation plasma models reproduced most of the observed emission lines and also accounted for all of the continuum emission. The level of counts is not large enough to make useful constraints on the components of the helium-like triplets of Mg XI or Ne IX, but an apparent enhancement of the forbidden line could be present. Furthermore, the hydrogen-like emission lines of Mg XII and Ne X were clearly detected with a significance of ∼5σ in our eclipse spectrum. Similar behaviour of these lines was also reported by Ebisawa et al. (1996), using ASCA data, and Wojdowski et al. (2003), using Chandra High-Energy Transmission Grating Spectrometer (HETGS) data. No other emission lines were reported by these authors in the wavelength band that we analysed from RGS where Ne X at 10.240 Å and Fe XVIII at 10.627 Å could be present. Cen X−3 was also observed with the Chandra satellite on December 30 2000 using HETGS (just one month before the first XMM-Newton observation and covering the same orbital phase interval, excluding the eclipse egress; Iaria et al. 2005). Remarkably, these authors did not report any detection of hydrogen-like emission lines, probably because they focused their analysis on the iron complex and the Si XIV emission line. Orbital phase-resolved spectra were also fitted with the same model we defined on the average spectrum. The H-like emission lines showed changes throughout the eclipse observation, although no other emission lines could be clearly distinguished from the continuum emission.
On the other hand, during the out-of-eclipse orbital phases, the NS is in the direct line of sight with the observer and the averaged spectrum shows a high X-ray continuum emission. On average, the source flux was around 50 times greater than in the eclipse from 7 Å to 11 Å, nearly 30 times from 11 Å to 15 Å, and it falls to the X-ray background flux above 20 Å. The continuum model was a highly absorbed power law component to describe the X-rays from the NS and a less absorbed power law plus a broad Gaussian component to account the scattered emission in the extended wind. Emission lines with a significance of ≳3σ were fitted with Gaussian line profiles. Residuals in the fit at 13.5 Å suggested the presence of the He-like ion Ne IX and it was found that  and 𝒢obs = (f + i)/r = 2.5 ± 2.4. At the temperature corresponding to the maximum of the He-like Ne abundance for a collisional plasma, i.e. 2.0 MK, the ℛ parameter points to an electron density of ∼(2 − 7)×1012 cm−3 but the curves for pure photoionised plasma and collisional plasma are indistinguishable (Porquet & Dubau 2000). Another indication of a hybrid plasma might be the value of 𝒢obs, which is consistent with a plasma temperature of 2.0 MK despite the large uncertainties (Porquet & Dubau 2000). In recent research, Sanjurjo-Ferrín et al. (2024) studied a ToO Chandra observation and reported the detection of He-like triplets Mg XI and Si XIII in the Chandra spectra of Cen X−3. From the Mg XI and Si XIII ions 𝒢 ratio values in Segment 3, they estimated a temperature of ∼7 × 10⁵ K and ∼7 × 10⁶ K, respectively (see Fig. 12 and Table 6 in Sanjurjo-Ferrín et al. 2024). From the He-like iron, Iaria et al. (2005) derived a temperature of the emitting region in the range of (1 − 4)×107 K assuming a photoionised plasma. Unfortunately, this emission line was not resolved in the XMM-Newton observation; therefore, it could not obtain an estimation of the temperature. Concerning the ℛ ratio in Segment 3, the value of Mg XI implied an electron density of ∼(1.5 − 5.0)×1012 cm−3 but it could not be calculated for Si XIII. These values are of the same order of magnitude as the fit results found in this work. However, the electron densities they obtained in Segments 1 and 2 were one or two orders of magnitude greater than the previous one, indicating significant plasma density variations depending on the location and orbital phase. Ebisawa et al. (1996) studied an observation with ASCA (orbital phase range [−0.31–0.20]), obtaining an electron density of ∼1.3 × 1011 cm−3, in agreement with Iaria et al. (2005, Chandra observation in the orbital phase range (0.13–0.40)). Possible structures around the NS could be an accretion disc or an accretion wake with an electron density as high as ∼1012 cm−3. It is also noticed that the equivalent hydrogen column derived in this work (NH ∼ 1022 cm−2) is one or two orders of magnitude smaller than the column density obtained by Sanjurjo-Ferrín et al. (2024). Therefore, it seems that the accretion and reprocessing environment in Cen X-3 during the Chandra observation was quite different when compared to XMM-Newton/RGS results.
The Ne IX and the Mg XI triplets cannot be clearly distinguished from the X-ray background in the eclipse spectrum. H-like ions of Mg XII and Ne X Ly β and He-like ions of Mg XI and Ne IX were detected in the out-of-eclipse spectra with a significance of ∼3σ but these helium-like triplets could not be well resolved. The broad Gaussian component used to describe the continuum enhancement centred at ∼12 Å is probably the reason that we were unable to detect the Ne X Ly α during the out-of-eclipse transition. Some new absorption features, compared to the eclipse-averaged spectrum, could be identified as Ne and Fe edges that should be part of the ISM matter in the line of sight of Cen X−3. No significant absorption lines were detected in our spectra with a significance of > 3σ.
According to the light curve of the out-of-eclipse observation, the X-ray flux fluctuated on short timescales presenting pronounced dips through this orbital phase interval. Orbital phase-resolved spectroscopy revealed that the decrease in the X-ray flux during the dip intervals was due to a drop in the accretion rate rather than an increase in the column density absorption. Nevertheless, the LCR spectrum presented a higher intrinsic absorption than the HCR spectrum and the reduction in the X-ray flux could be produced by the rise in the column density in the direct emission (PL1 component) and by a reduction in the accretion rate in the scattered emission (PL2 component). It is also noted that the radiation emitted by the broad Gaussian component disappeared totally in the LCR-dip spectrum, while remaining nearly constant in the other spectra taking the uncertainties into account.
5. Conclusion
We have analysed two XMM-Newton/RGS spectra of Cen X−3, both averaged and resolved, taken in two complementary orbital phase intervals about six years apart. From the light curves, we derived the orbital phase range of the observations and did time-resolved spectroscopy to analyse the changes in the emission lines and in the continuum parameters with the orbital period. As was expected, we needed different model components to fit each average spectrum and revealed significant different behaviour depending on the orbital phase of the Cen X−3 system. We found strong variations in the source flux, especially in the out-of-eclipse observation. The continuum emission during the eclipse observation was reasonably fitted by two hot collisionally ionised plasmas, which also explained the observed emission line of hydrogen-ions. During the out-of-eclipse observation, a phenomenological model was applied for fitting the X-ray emission. Any attempt to describe these spectra by a photoionised plasma failed or had a worse fit compared to the models used in this work. However, it is quite probably that a mixture of collisional and photoionised plasmas may be present in this X-ray binary system. To confirm this hypothesis, a high-resolution and high signal-to-noise X-ray spectrum should be observed, to detect as many He-like emission lines as possible and resolve the resonant, inter-combination, and forbidden components.
RGS could clearly detect emission lines from the hydrogenic ions of Ne and Mg and showed evidence of other emission lines such as Si V, Mg XI, Ne X (10.240 Å), and Fe XVIII (10.627 Å), although these were difficult to distinguish from the X-ray continuum in the eclipse-egress spectrum. Although the helium-like triplet of neon seemed to be present in both spectra, it could not be clearly distinguished from the X-ray background in the eclipse spectrum. On the other hand, the line ratios, ℛobs and 𝒢obs, derived from the out-of-eclipse were consistent with the ratios obtained by Iaria et al. (2005) and Sanjurjo-Ferrín et al. (2024). The He-like ions such as Mg XI or Ne IX provide useful diagnostics for X-ray emitting plasma. Unfortunately, RGS could not resolve or detect these triplets in both observations, and therefore we could not estimate the average distances from the stellar surface of these ions. It should be interesting to use simultaneous observations with RGS and HETG to investigate He-like triplet lines to improve the knowledge of the accretion and/or reprocessing plasma in the surrounding of the NS. Moreover, Cen X−3 is one of the main sources to be observed with The X-Ray Imaging and Spectroscopy Mission (XRISM), opening up a new era in high-resolution X-ray spectroscopy thanks to the microcalorimeter instrumentation.
Other absorption features detected in the out-of-eclipse spectrum should be formed in the ISM in the line of sight in the direction of Cen X−3. However, the features produced by molecules in a certain absorption edge are similar and degenerate. Near the Fe L-edge, the RGS absorption lines blend and may be produced by other elements or ion transitions (Pinto et al. 2013).
Acknowledgments
The author(s) acknowledge the financial support from the MCIN with funding from the European Union NextGenerationEU and Generalitat Valenciana in the call Programa de Planes Complementarios de I+D+i (PRTR 2022). Project (Athena-XIFU-UA), reference ASFAE/2022/002. J.J.R.R. acknowledges financial support from the Spanish Ministry of Science, Innovation and Universities fellowship PRX23/00270, and also thanks all the staff from SRON for their collaboration and hospitality there. We would like to thank particularly Liyi Gu and Jelle de Plaa for invaluable assistance in analysing RGS data. The research leading to these results has received funding from the European Union’s Horizon 2020 Programme under the AHEAD project (grant agreement n. 654215). We acknowledge the constructive report of the referee whose comments helped us to improve the content of this paper. Part of this work has been developed in the framework of the PID2024-155779OB-C33 project.
References
- Amato, R., Grinberg, V., Hell, N., et al. 2021, A&A, 648, A105 [NASA ADS] [CrossRef] [EDP Sciences] [Google Scholar]
- Bailer-Jones, C. A. L., Rybizki, J., Fouesneau, M., Demleitner, M., & Andrae, R. 2021, AJ, 161, 147 [Google Scholar]
- Day, C. S. R., & Stevens, I. R. 1993, ApJ, 403, 322 [Google Scholar]
- de Plaa, J., Kaastra, J. S., Tamura, T., et al. 2004, A&A, 423, 49 [NASA ADS] [CrossRef] [EDP Sciences] [Google Scholar]
- den Herder, J. W., Brinkman, A. C., Kahn, S. M., et al. 2001, A&A, 365, L7 [NASA ADS] [CrossRef] [EDP Sciences] [Google Scholar]
- Dere, K. P., Landi, E., Young, P. R., & Del Zanna, G. 2001, ApJS, 134, 331 [Google Scholar]
- Ebisawa, K., Day, C. S. R., Kallman, T. R., et al. 1996, PASJ, 48, 425 [NASA ADS] [Google Scholar]
- Falanga, M., Bozzo, E., Lutovinov, A., et al. 2015, A&A, 577, A130 [NASA ADS] [CrossRef] [EDP Sciences] [Google Scholar]
- Grinberg, V., Hell, N., El Mellah, I., et al. 2017, A&A, 608, A143 [NASA ADS] [CrossRef] [EDP Sciences] [Google Scholar]
- Hua, X.-M., & Titarchuk, L. 1995, ApJ, 449, 188 [Google Scholar]
- Hutchings, J. B., Cowley, A. P., Crampton, D., van Paradijs, J., & White, N. E. 1979, ApJ, 229, 1079 [NASA ADS] [CrossRef] [Google Scholar]
- Iaria, R., Di Salvo, T., Robba, N. R., et al. 2005, ApJ, 634, L161 [NASA ADS] [CrossRef] [Google Scholar]
- Kaastra, J. S., Mewe, R., & Nieuwenhuijzen, H. 1996, in UV and X-ray Spectroscopy of Astrophysical and Laboratory Plasmas, eds. K. Yamashita, & T. Watanabe, 411 [Google Scholar]
- Kaastra, J. S., de Vries, C. P., Steenbrugge, K. C., et al. 2011, A&A, 534, A37 [NASA ADS] [CrossRef] [EDP Sciences] [Google Scholar]
- Kelly, R. L. 1987, J. Phys. Chem. Ref. Data, 17 [Google Scholar]
- Krzeminski, W. 1974, ApJ, 192, L135 [NASA ADS] [CrossRef] [Google Scholar]
- Leutenegger, M. A., Paerels, F. B. S., Kahn, S. M., & Cohen, D. H. 2006, ApJ, 650, 1096 [Google Scholar]
- Lodders, K., & Palme, H. 2009, Meteorit. Planet. Sci. Suppl., 72, 5154 [Google Scholar]
- Mehdipour, M., Kaastra, J. S., & Raassen, A. J. J. 2015, A&A, 579, A87 [NASA ADS] [CrossRef] [EDP Sciences] [Google Scholar]
- Mehdipour, M., Kaastra, J. S., & Kallman, T. 2016, A&A, 596, A65 [NASA ADS] [CrossRef] [EDP Sciences] [Google Scholar]
- Mewe, R., & Schrijver, J. 1978, A&A, 65, 99 [NASA ADS] [Google Scholar]
- Naik, S., & Paul, B. 2012, Bull. Astron. Soc. India, 40, 503 [NASA ADS] [Google Scholar]
- Pinto, C., Kaastra, J. S., Costantini, E., & de Vries, C. 2013, A&A, 551, A25 [NASA ADS] [CrossRef] [EDP Sciences] [Google Scholar]
- Porquet, D., & Dubau, J. 2000, A&AS, 143, 495 [NASA ADS] [CrossRef] [EDP Sciences] [Google Scholar]
- Porquet, D., Mewe, R., Dubau, J., Raassen, A. J. J., & Kaastra, J. S. 2001, A&A, 376, 1113 [NASA ADS] [CrossRef] [EDP Sciences] [Google Scholar]
- Raassen, A. J. J., van der Hucht, K. A., Miller, N. A., & Cassinelli, J. P. 2008, A&A, 478, 513 [NASA ADS] [CrossRef] [EDP Sciences] [Google Scholar]
- Sanjurjo-Ferrín, G., Torrejón, J. M., Postnov, K., et al. 2021, MNRAS, 501, 5892 [CrossRef] [Google Scholar]
- Sanjurjo-Ferrín, G., Torrejón, J. M., Oskinova, L., et al. 2024, A&A, 690, A360 [NASA ADS] [CrossRef] [EDP Sciences] [Google Scholar]
- Schreier, E., Levinson, R., Gursky, H., et al. 1972, ApJ, 172, L79 [NASA ADS] [CrossRef] [Google Scholar]
- Steenbrugge, K. C., Kaastra, J. S., Crenshaw, D. M., et al. 2005, A&A, 434, 569 [NASA ADS] [CrossRef] [EDP Sciences] [Google Scholar]
- Thompson, T. W. J., & Rothschild, R. E. 2009, ApJ, 691, 1744 [NASA ADS] [CrossRef] [Google Scholar]
- Tjemkes, S. A., van Paradijs, J., & Zuiderwijk, E. J. 1986, A&A, 154, 77 [NASA ADS] [Google Scholar]
- Waldron, W. L., & Cassinelli, J. P. 2001, ApJ, 548, L45 [Google Scholar]
- White, N. E., Swank, J. H., & Holt, S. S. 1983, ApJ, 270, 711 [NASA ADS] [CrossRef] [Google Scholar]
- Willingale, R., Starling, R. L. C., Beardmore, A. P., Tanvir, N. R., & O’Brien, P. T. 2013, MNRAS, 431, 394 [Google Scholar]
- Wojdowski, P. S., Liedahl, D. A., Sako, M., Kahn, S. M., & Paerels, F. 2003, ApJ, 582, 959 [Google Scholar]
Appendix A: Emission lines
Parameters of the emission lines according to the fit results from the three models.
All Tables
Parameters of the emission lines according to the fit results from the three models.
Spectral fit parameters to the 0111010101 orbital phase-averaged and phase-resolved spectra.
Parameters of the emission lines according to the fit results from the three models.
All Figures
|
Fig. 1. Light curves and hardness ratio of the first (0111010101) low state observation (left) and the second (0400550201) high state (right) observation with RGS. Intervals with high background have already been taken out. |
| In the text | |
|
Fig. 2. RGS data, photoionisation-dominated model (green circle), collisional-dominated model (red triangle), Gaussian emission lines (blue square), and residuals (expressed in terms of number of standard deviations) for the 0111010101 orbital phase-averaged spectrum. |
| In the text | |
|
Fig. 3. RGS data, model (two cie components), and relative residuals for the 0111010101 orbital phase-averaged spectrum. |
| In the text | |
|
Fig. 4. RGS data, continuum model, and residuals (in terms of number of standard deviations) for the 0400550201 orbital phase-averaged spectrum. The dashed lines indicate possible emission or absorption lines detected at the 3σ level. |
| In the text | |
|
Fig. 5. Ne IX triplet with best-fit model. Resonance (r), inter-combination (i), and forbidden (f) components are indicated at observed wavelengths. |
| In the text | |
|
Fig. 6. RGS data, model, and relative residuals for the orbital phase-resolved spectra. From top to bottom: Eclipse, eclipse-egress, and egress in the 0111010101 ID observation. |
| In the text | |
|
Fig. 8. RGS data, model, and residuals in terms of standard deviations for the high (left panels) and low (right panels) count rate spectra in the 0400550201 ID observation. |
| In the text | |
|
Fig. 7. Correlation of the unabsorbed flux (red square corresponds to Cie1 and blue circle corresponds to Cie2) versus the column density, NH. |
| In the text | |
|
Fig. 9. Dips GTIs intervals. The vertical dash-dotted green line indicates the HCR (on the left) and LCR (on the right) time intervals. The vertical dash-dotted dark blue and light blue lines indicate the dips from the HCR and LCR time intervals, respectively. |
| In the text | |
Current usage metrics show cumulative count of Article Views (full-text article views including HTML views, PDF and ePub downloads, according to the available data) and Abstracts Views on Vision4Press platform.
Data correspond to usage on the plateform after 2015. The current usage metrics is available 48-96 hours after online publication and is updated daily on week days.
Initial download of the metrics may take a while.