Open Access
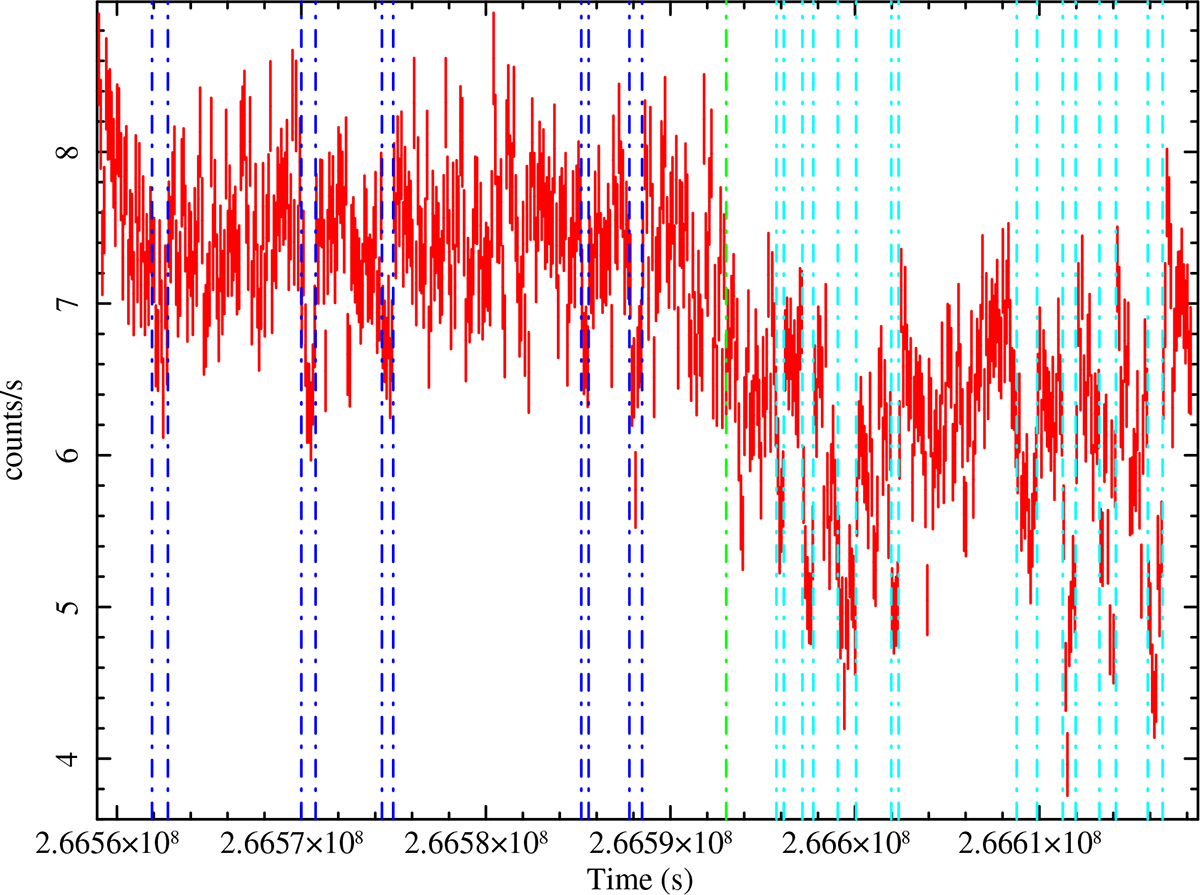
Fig. 9.
Download original image
Dips GTIs intervals. The vertical dash-dotted green line indicates the HCR (on the left) and LCR (on the right) time intervals. The vertical dash-dotted dark blue and light blue lines indicate the dips from the HCR and LCR time intervals, respectively.
Current usage metrics show cumulative count of Article Views (full-text article views including HTML views, PDF and ePub downloads, according to the available data) and Abstracts Views on Vision4Press platform.
Data correspond to usage on the plateform after 2015. The current usage metrics is available 48-96 hours after online publication and is updated daily on week days.
Initial download of the metrics may take a while.