Fig. 1
Download original image
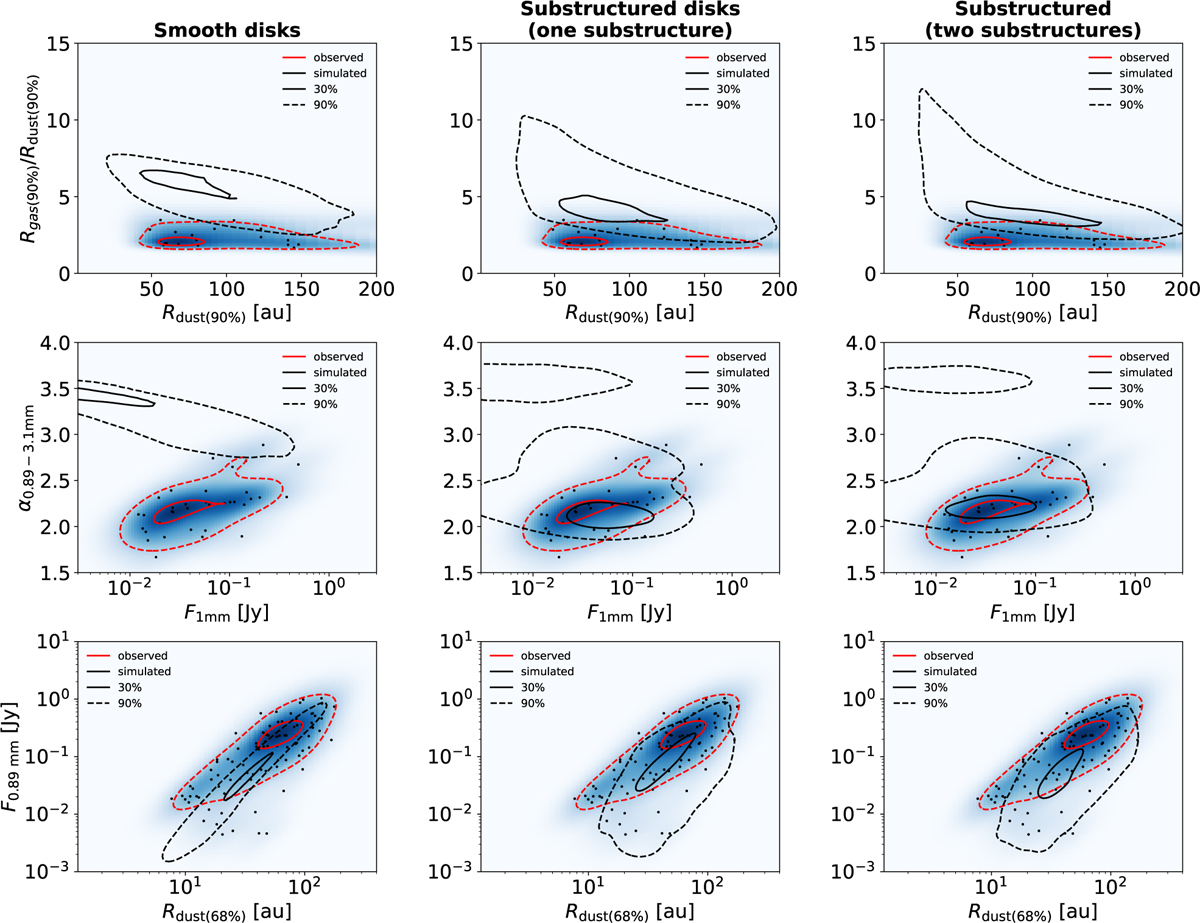
Gas-dust size distribution (first row), spectral index distribution (second row), and size-luminosity distribution (third row) for the parameter space of the initial conditions selecting disks with a spectral index of 0 ≤ α0.89–3.1 mm ≤ 4, 10−3 Jy ≤ F1mm ≤ 10 Jy, 10−3 Jy ≤ F0.89mm ≤ 10 Jy, 100.1 au ≤ Rdust(68%) ≤ 102.6 au, 1 au ≤ Rdust(90%) ≤ 200 au, and 0.1 ≤ Rgas(90%)/Rdust(90%) ≤ 20. Left plots: Smooth disks. Middle plots: Substructured disks with one planet randomly inserted in a range between 0.1–0.4 Myr from the start of the disk evolution. Right plots: substructured disks with two planets randomly inserted in a range between 0.1–0.4 Myr (innermost planet) and between 0.5–0.8 Myr (outermost planet) from the start of the disk evolution. Heatmap of the observed disks with the black dots representing each single observed disk. The black and red lines refer to the simulated results and the observational results, respectively. In particular, the continuous lines encompass 30% of the cumulative sum of the disks produced from the simulations or observed. The dashed lines encompass the 90% instead.
Current usage metrics show cumulative count of Article Views (full-text article views including HTML views, PDF and ePub downloads, according to the available data) and Abstracts Views on Vision4Press platform.
Data correspond to usage on the plateform after 2015. The current usage metrics is available 48-96 hours after online publication and is updated daily on week days.
Initial download of the metrics may take a while.