Fig. A.2
Download original image
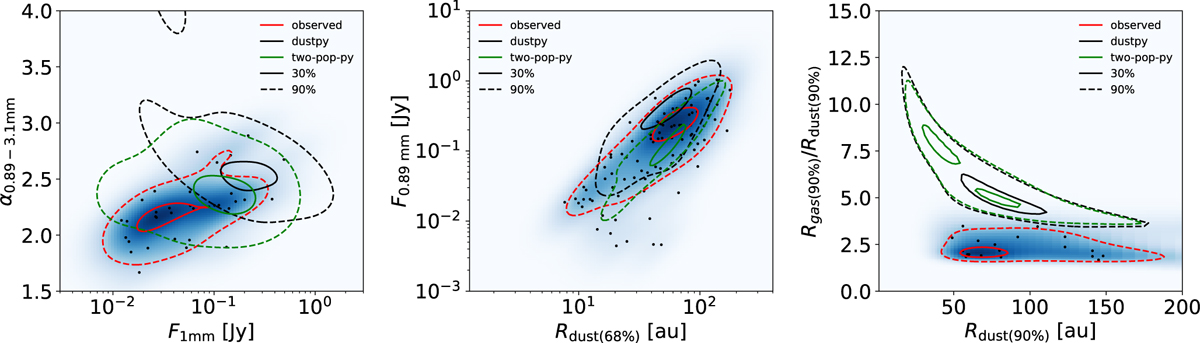
Spectral index distribution (left), size-luminosity distribution (middle), and gas-dust size distribution (right) comparison between DustPy and two-pop-py at 1 Myr for a test population of substructured disks. Both test populations are constructed by sampling all combinations of the following parameters: α = 0.001, Mstar = [0.3, 1.0] Msun, Mdisk = 0.01 Mstar, rc = [20, 50, 100] au, vfrag = 1000 cm/s, rp = [0.5, 0.7] rc, and mp = 1 MJ.
Current usage metrics show cumulative count of Article Views (full-text article views including HTML views, PDF and ePub downloads, according to the available data) and Abstracts Views on Vision4Press platform.
Data correspond to usage on the plateform after 2015. The current usage metrics is available 48-96 hours after online publication and is updated daily on week days.
Initial download of the metrics may take a while.