Fig. 1
Download original image
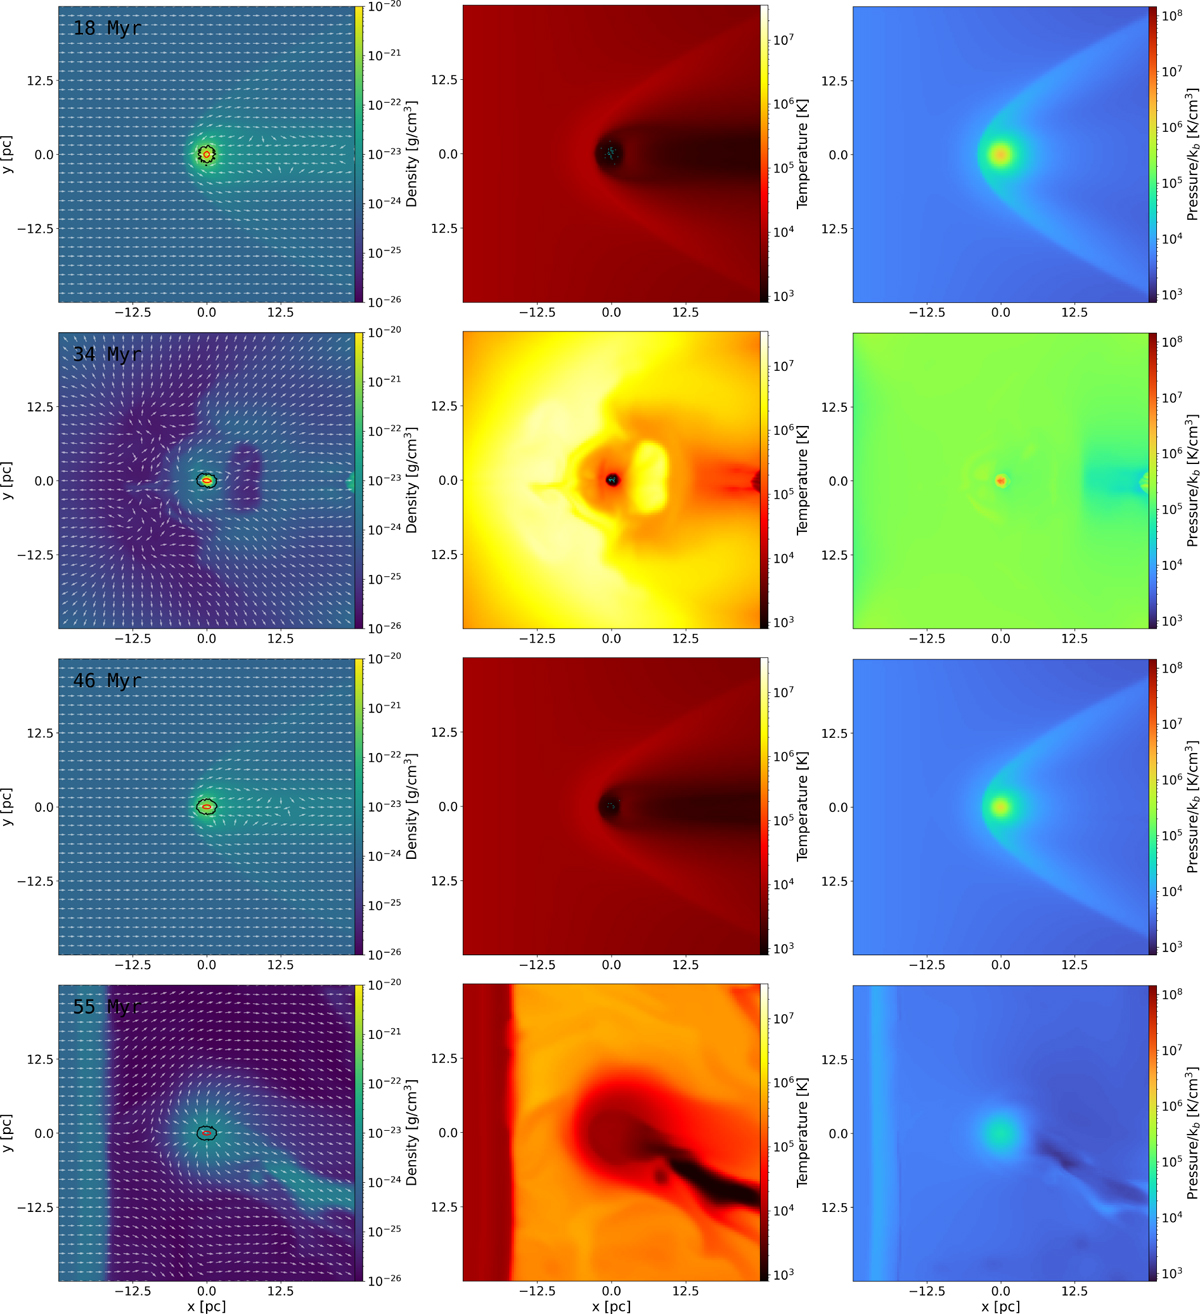
Two-dimensional maps of the gas density (left-hand panels) and of the temperature (central panels) and the pressure (right-hand panels) on the x-y plane for the M5I24 simulation. The corresponding evolutionary time of each set of panels is reported in the density map, together with the velocity field denoted by the white arrows (all arrows have the same length, so no information on the intensity of the field is reported), and the contours describing the region enclosing the 75% and 95% of the SG mass in red and black, respectively. The cyan points on the temperature map represent newborn stars (age <0.05 Myr).
Current usage metrics show cumulative count of Article Views (full-text article views including HTML views, PDF and ePub downloads, according to the available data) and Abstracts Views on Vision4Press platform.
Data correspond to usage on the plateform after 2015. The current usage metrics is available 48-96 hours after online publication and is updated daily on week days.
Initial download of the metrics may take a while.