| Issue |
A&A
Volume 708, April 2026
|
|
|---|---|---|
| Article Number | A25 | |
| Number of page(s) | 16 | |
| Section | Galactic structure, stellar clusters and populations | |
| DOI | https://doi.org/10.1051/0004-6361/202554965 | |
| Published online | 27 March 2026 | |
Type Ia supernova feedback effects on globular clusters of different masses
1
INAF – OAS, Osservatorio di Astrofisica e Scienza dello Spazio di Bologna,
via Gobetti 93/3,
40129
Bologna,
Italy
2
Dipartimento di Fisica e Astronomia “Augusto Righi”, Alma Mater Studiorum - Unversità di Bologna,
via Gobetti 93/3,
40129
Bologna,
Italy
3
Dipartimento di Fisica e Astronomia “Galileo Galilei”, Univerisità di Padova,
Vicolo dell’Osservatorio 3,
35122
Padova,
Italy
4
Institut für Theoretische Astrophysik, ZAH, Universität Heidelberg,
Albert-Ueberle-Straße 2,
69120
Heidelberg,
Germany
5
INFN – Padova,
Via Marzolo 8,
35131
Padova,
Italy
6
Dipartimento di Scienza e Alta Tecnologia, Università degli Studi dell’Insubria,
via Valleggio 11,
22100
Como,
Italy
7
INFN, Sezione di Milano-Bicocca,
Piazza della Scienza 3,
20126
Milano,
Italy
8
Institute for Research in Fundamental Sciences (IPM),
Larak Garden,
19395-5531
Tehran,
Iran
9
Univ Lyon, Univ Lyon1, Ens de Lyon, CNRS, Centre de Recherche Astrophysique de Lyon UMR5574,
69230
Saint-Genis-Laval,
France
★ Corresponding author: This email address is being protected from spambots. You need JavaScript enabled to view it.
Received:
1
April
2025
Accepted:
25
September
2025
Abstract
Through 3D hydrodynamical simulations, we explore the impact of Type Ia supernova (SN) explosions on the star formation history and chemical properties of second-generation (SG) stars in young globular clusters with masses of 105−106M⊙. We assume that the SG is formed out of the asymptotic giant branch (AGB) ejecta of first-generation stars plus pristine interstellar medium gas which is modelled as a uniform gas moving at a constant velocity towards the cluster. We tested two values for the infalling gas density of 10−24 and 10−23 g cm−3. Type Ia SNe start to explode together with the release of gas from the most massive AGB stars. Three simulated models are analysed. In the low-mass and low-density scenario, we find SNe Ia quench star formation that however restarts when the gas cools down again in between two explosions. The SG stars are dominated by a He-rich population (Y > 0.33), which is poorly diluted by pristine gas. In the high-mass models, star formation is mildly affected, while the He composition is significantly altered as exploding SNe prevent the accretion of pristine gas, and therefore extremely helium-rich stars form. In the high-density model, such weak gas accretion leads to a maximum enhancement in the helium mass fraction that is much larger than the observed one and that does not correlate with the initial cluster mass as is found in models without Type Ia SNe. As for the iron content, small spreads have been found in all models, but the SG is less homogeneous than the FG, at variance with current observations.
Key words: hydrodynamics / methods: numerical / ISM: supernova remnants / globular clusters: general / galaxies: star formation
© The Authors 2026
 Open Access article, published by EDP Sciences, under the terms of the Creative Commons Attribution License (https://creativecommons.org/licenses/by/4.0), which permits unrestricted use, distribution, and reproduction in any medium, provided the original work is properly cited.
This article is published in open access under the Subscribe to Open model. This email address is being protected from spambots. You need JavaScript enabled to view it. to support open access publication.
1 Introduction
Over the past decades, numerous photometric and spectroscopic studies have revealed that Galactic globular clusters (GCs) host multiple stellar populations, challenging the long-standing view of GCs as single stellar populations (SSPs). The first indications of multiple populations within GCs emerged from studies on the chemical composition of their stars. Some stars displayed chemical abundances rarely observed in field stars, with anomalies primarily involving light elements such as C, N, Na and O (see, for example, Carretta et al. 2009a,b,c; Gratton et al. 2019 and references therein).
Subsequent photometric investigations further supported these findings by identifying splits in sequences within the colour-magnitude diagram of GCs, providing additional evidence of multiple populations in the same cluster (Lee et al. 1999; Pancino et al. 2000; Piotto et al. 2005; Marino et al. 2008; Milone et al. 2017, 2012). Stars with chemical compositions akin to those in the field are thought to represent the first generation (FG) of stars, while ’anomalous’ stars - those enriched in He, N, Na, and depleted in O and C - are associated with subsequent generations. Such chemical variations have been observed in GCs in nearby galaxies such as the Magellanic Clouds (Mucciarelli et al. 2009), Fornax (Larsen et al. 2014), and M31 (Nardiello et al. 2019), making multiple stellar populations ubiquitous.
Until some years ago, both generations were thought to share the same metallicity content apart from a small group of clusters, labelled Type II GCs, where a spread in metallicity was observed (Johnson et al. 2015; Milone et al. 2017). Recently, both photometric (Legnardi et al. 2022; Lardo et al. 2022) and spectroscopic (Marino et al. 2019) studies of Galactic GCs (such as NGC 3201 and M 2) have revealed a metallicity spread as large as 0.3 dex in FG stars (Lardo et al. 2023), suggesting that these stars were formed out of chemically inhomogeneous gas. Surprisingly, the second generation instead displays a much narrower spread, which could provide important information on how anomalous stars were formed.
The precise mechanisms and timeline for the formation of chemically peculiar stars, and in general GCs, remain still unclear, despite a number of scenarios having been proposed in the literature. None of the proposed models fully accounts for all the observed features and trends without facing some challenges (see Renzini et al. 2015; Bastian & Lardo 2018; Gratton et al. 2019). Among the various theories, the asymptotic giant branch (AGB) scenario has been the most extensively explored in the past years (D’Antona & Caloi 2004; D’Ercole et al. 2008; Bekki 2011). In this scenario, the FG of stars forms all at once with the same chemical composition. Following this, feedback from massive stars, both in the pre-supernova (SN) and SN phases, clears the system of any gas, preventing the enrichment of the remaining material by massive star ejecta (Calura et al. 2015). Afterwards, a second generation of stars can form from the ejecta of FG AGB stars mixed with gas that has the same composition as FG stars (see D’Ercole et al. 2010; Calura et al. 2019; Yaghoobi et al. 2022a). Other models propose that second-generation (SG) stars arise from gas expelled by fast-rotating massive stars (Decressin et al. 2007), massive interacting binaries (de Mink et al. 2009), very massive stars (Vink 2018), supermassive (m ~ 104M⊙) stars (Denissenkov & Hartwick 2014; Gieles et al. 2018), supergiant stars (Szécsi et al. 2018), black hole accretion discs (Breen 2018) and stellar mergers (Wang et al. 2020).
We focus here on the AGB scenario, which has been significantly explored in recent years (Calura et al. 2019; Lacchin et al. 2021, 2022; McKenzie & Bekki 2021; Yaghoobi et al. 2022a,b, 2024). In particular, our aim is to extend the work of Lacchin et al. (2021) studying the effects of Type Ia SNe on the star formation of lower-mass clusters, such as those simulated by Yaghoobi et al. (2022a). Type Ia SNe have long been assumed to be responsible for the quenching of the star formation of the second generation based on the pioneering results of D’Ercole et al. (2008), who performed 1D hydrodynamic simulations of GCs with initial masses of 106−7M⊙ with and without Type Ia SN feedback. D’Ercole et al. (2008) found that in the models with SN Ia feedback, once the first SNe were going off, the gas was rapidly wiped out of the system leading to an almost immediate quenching of the star formation. However, their SNe were located in the centre of the cluster, and this could significantly increase the energy deposited in the inner regions, where stars are forming. In Lacchin et al. (2021), we performed 3D hydrodynamic simulations of a 107 M⊙ cluster and found that, with a more realistic spatial distribution of the SNe, star formation was not halted immediately after the first explosions. In the extreme case in which a high interstellar medium density is assumed, the star formation rate (SFR) is not affected by SN Ia explosions. Moreover, we have shown that when star formation is reduced, the helium mass fraction of the newborn stars is much higher than expected. The pristine gas is not able to continuously provide helium-poor gas to dilute the helium-rich AGB ejecta, and therefore most of the stars are formed from undiluted material. Later, Yaghoobi et al. (2022a) performed similar simulations for lower-mass clusters without including Type Ia SNe. Combining their results with the ones of Calura et al. (2019), they were able to obtain positive correlations between the SG-to-total number ratio and maximum He enhancement in SG stars as a function of the initial cluster mass in agreement with observations. In this work, we include Type Ia SNe in the low-mass cluster models of Yaghoobi et al. (2022a) to explore the role of this source of feedback both on the star formation and on the chemical composition of SG stars and determine whether the scaling relations derived by Yaghoobi et al. (2022a) are affected or not by the presence of Type Ia SNe.
The paper is organised as follows: in Section 2 we describe the set-up of the simulations and the main physical ingredients included in the simulations. In Section 3 we present the results of our set of simulations which we discuss in Section 4. Finally in Section 5 we draw the conclusions of our work.
2 Simulation set-up
In this work, we extend the study of Lacchin et al. (2021) to lower masses. In particular, we model clusters with a mass of 105−106M⊙ and a half-mass radius of 4 pc as has been done by Yaghoobi et al. (2022a), but we include the feedback from Type Ia SNe The initial radius has been assumed to be equal for both cluster masses, as observations have revealed a flat-radius cluster mass relation below Mcl = 106M⊙ (Krumholz et al. 2019). We adopted a customised version of the RAMSES hydrocode (Teyssier 2002) to study how Type Ia SNe affects the formation and the chemical composition (in terms of helium and iron) of SG stars. The code uses a second-order Godunov scheme to solve the Euler equations and a particle-mesh solver to compute the dynamical evolution of particles. For all simulations, we fixed the box size to L3 = (50 pc)3, which was refined exploiting the adaptive mesh refinement (AMR) technique. The maximum resolution reached in our simulations is 0.1 pc as in Yaghoobi et al. (2022a), and much smaller than in Lacchin et al. (2021) since the clusters we are modelling here are much more compact and, therefore higher resolutions are required to characterise them. In Lacchin et al. (2021), we have not exploited the AMR as the whole box was refined at the maximum level shortly after the beginning of the simulations due to the AGB ejecta. In these simulations, instead, the large dimension of the box compared to the size of the cluster makes AMR very effective.
2.1 Initial set-up
We briefly describe the set-up of our simulations which is the same as in Lacchin et al. (2021) and Yaghoobi et al. (2022a): we therefore advise the reader to consult these works for further details. The starting point of all our runs, t0, lies 31.3 Myr after the formation of the FG as in Yaghoobi et al. (2022a), when core-collapse SNe have already cleared out the system from gas (Calura et al. 2015) and have carved a hole in the interstellar medium (ISM). The cluster is then composed of low- and intermediate-mass stars belonging to the FG, which was modeled as a static Plummer (1911) profile with Plummer radius a = 3 pc. Following D’Ercole et al. (2016), we assume that the cluster is orbiting in the disc of a high-z star-forming galaxy. This implies that the cluster meets the ISM gas asymmetrically. We thus fix the cluster at the centre of our computational box and, at time tinf, gas is imposed to flow inside the box from one of the boundaries. The value of tinf depends on the stagnation point of the core-collapse supernovae (CC-SN) driven bubble, i.e. where the ram pressure of the SN-driven wind balances the ISM pressure. The location of this point depends on the density of the ISM, ρpg, and the mass of the FG, MFG, as described in D’Ercole et al. (2016). In all our simulations we calculate tinf through equation 11 of D’Ercole et al. (2016), as done in Lacchin et al. (2021) and Yaghoobi et al. (2022a). In addition, 39 Myr after the FG formation, the FG starts releasing the ejecta of the most massive AGB stars and of Type Ia SNe.
For all the six sides of our computational box we adopt outflow boundary conditions. At tinf, the gas is allowed to enter the box from the yz plane at negative x with a velocity vpg.
In Table 1, we have listed the main parameters adopted in the present work, where we tested two values both for the density of the pristine gas ρpg, to represent a typical dwarf galaxy
Parameters of the simulations.
Models description.
2.2 Star formation
The star formation is modelled in a subgrid fashion described in Rasera & Teyssier (2006). A star particle is allowed to form only in cells where: i) the gas is neutral, which means that the temperature is T < 2 × 10⁴ K, ii) the velocity field is convergent ∇ ∙ v < 0.
Once a cell satisfies both these requirements, the gas is converted into star particles following the Schmidt (1959) law:
 (1)
(1)
where t* corresponds to the star formation timescale, proportional to the free-fall time and set to t* = 0.1 Gyr. The mass associated with every stellar particle is Mp = Nm0 where m0 is the minimum mass a star can have and N is sampled from a Poisson distribution. The particle is located in the centre of the cell and its velocity and chemical composition are the same as the parental gas cell.
2.3 AGB feedback
The mass and energy return of AGB stars was modelled by introducing a source term in both the mass and energy conservation equation. The mass injection by AGB stars, per units time and volume is
 (2)
(2)
where α is the specific mass return rate of the FG component, while ρ* is the local density of FG stars.
The injected energy by AGB stars per unit time and volume is
 (3)
(3)
where σ is the 1D velocity dispersion of FG stars, while v and vwind are, respectively, the gas velocity and the wind velocity of AGB stars. We assume vwind ~ 2 × 106cm s−1 (D’Ercole et al. 2008).
In addition, we trace the helium abundance of both the gas and the SG stars adopting the same yields as in Calura et al. (2019) and Lacchin et al. (2021) for AGB stars. No iron is assumed to be produced in low- and intermediate-mass stars; therefore, the iron composition of AGB ejecta is the same as that of the pristine gas (see Table 2).
2.4 Type Ia supernova feedback
Together with the AGB feedback, here we also model Type Ia SNe as in Lacchin et al. (2021). SNe Ia are spatially distributed following the Plummer (1911) profile, computed for a cluster of mass MFG and Plummer radius 3 pc. The maximum radius at which SNe are located corresponds to half of the computational box size, which means that all of them are exploding inside it. Concerning the temporal distribution, we distribute them following the Greggio (2005, their equation 14) delay time distribution (DTD) for the single degenerate scenario. The rate of SNe Ia explosions depends on the mass of the system MFG and on the assumed IMF. For a Kroupa (2001) IMF and in the time span we are interested in (of about 0.1 Gyr), the number of SNe Ia will be ∼10 for a cluster with a mass MFG = 105 M⊙ and ∼100 for MFG = 106M⊙. In order to have a good sampling both of the DTD and of the Plummer profile, we have created 1000 random realisations both for their spatial and temporal distributions and then chosen the one that deviates less from the mean. In addition to helium, we trace the evolution of iron, in order to study the effects of SNe Ia on the chemical composition of SG stars and compare the iron content with observations. Once a SN explodes, we inject a Chandrasekar mass of metals, out of which 0.5 M⊙ of iron (Scalzo et al. 2014). We also assume that for every explosion 1051 erg of thermal energy (Blondin 2024) are injected into the system. As done by Lacchin et al. (2021), we have checked that our SN remnants are well resolved in all our simulations. With the high resolution used here, none of the SNe fall in the overcooling regime derived using the criterion provided by Kim & Ostriker (2015).
2.5 Cooling
We adopted the built-in RAMSES implementation for radiative gas cooling where the cooling rates of hydrogen, helium and metals are taken into account (Few et al. 2014). We adopted a temperature floor of T = 103 K (see Calura et al. 2019), while the temperature of the inflowing gas is assumed to be T = 104 K, a reasonable value for a warm photoionised ISM in a star-forming galaxy (Haffner et al. 2009).
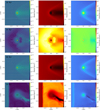 |
Fig. 1 Two-dimensional maps of the gas density (left-hand panels) and of the temperature (central panels) and the pressure (right-hand panels) on the x-y plane for the M5I24 simulation. The corresponding evolutionary time of each set of panels is reported in the density map, together with the velocity field denoted by the white arrows (all arrows have the same length, so no information on the intensity of the field is reported), and the contours describing the region enclosing the 75% and 95% of the SG mass in red and black, respectively. The cyan points on the temperature map represent newborn stars (age <0.05 Myr). |
3 Results
In this paper, we present the results for three models, all of them taking into account the feedback from Type Ia SNe. We have performed two runs, the M6I23 and the M6I24, varying only the density of the pristine gas (see Table 2 for the details of all the models) for the cluster with an initial mass of 106 M⊙, while for the cluster with mass 105 M⊙, we present here only the model M5I24, with a low-density ISM gas.
3.1 Low-density models
3.1.1 Model M5I24
The model M5I24 has an initial cluster mass of MFG = 105 M⊙ and a pristine gas density of ρpg = 10−24 gcm−3. Figure 1 shows four snapshots at different evolutionary times of gas density, temperature, and pressure for this model, obtained by selecting a slice of the x - y plane passing through the centre of the box. The pristine gas in this model enters the box 3 Myr after the beginning of the simulation and 4.7 Myr before the AGB ejecta start to be released. Despite that, star formation starts only several Myr after, at around 10 Myr as found in Yaghoobi et al. (2022a) due to the effect of the ram pressure on a shallow gravitational potential well. In the first snapshot of Figure 1, a SG system has already formed with an almost spherical shape as shown also in Figure 2. The direction of the infalling gas is weakly perturbed, as visible from the velocity field and, at variance with other models (see Calura et al. 2019; Yaghoobi et al. 2022a), an accretion column is not formed downstream of the system due to the cluster’s limited ability to accumulate pristine gas behind it. Even though some gas is moving towards the centre of the cluster, its velocity is negligible, as shown by Yaghoobi et al. (2022a). At 34 Myr, the SG component is more flattened than before in the direction of the infall. The gas in the outer regions is much less dense, hotter, and the pressure has increased as a response to a recent SN explosion. The infall has been confined far from the centre as the gas perturbed by the explosion still moves outwards. The 46 Myr snapshot represents the system between two SN explosions as in the first snapshot and resembles the maps shown by Yaghoobi et al. (2022a), with the bow-shock profile typical of a massive perturber in motion through a gas distribution (Calura et al. 2019 and references therein). At this time, the infall has filled again the whole box and downstream of the system gas is moving towards the centre but an accretion column is not formed as seen in the simulation without SNe. In the last snapshot at 55 Myr the infall is still filling the void created by a SN explosion that has significantly lowered the density and increased the temperature of both the central region and its surroundings. The SG system in the last three snapshots is flattened in the direction of the infalling gas, as shown in Figure 2. As found in previous works, the SG is more centrally concentrated than the FG as the AGB ejecta cool down and sink towards the centre, where they then form new stars.
The distribution of Y, shown in Figure 3, has a similar range as Yaghoobi et al. (2022a) while its shape is different and forged by the SN feedback. Two peaks are present as a result of the quenching of star formation caused by the explosions which prevent a smooth formation of stars with decreasing helium mass fraction. This is highlighted in Figure 4, where the stellar helium mass fraction is plotted as a function of the birthtime of SG particles. Overall, Y decreases with time as stars with lower mass produce less helium during the AGB phase and because of the dilution of AGB ejecta with infalling gas. The SFR is modulated by SNe Ia and, in particular at around 40 Myr, the star formation is halted for several Myr and the stars formed after have a much lower Y, creating the second peak in the histogram. In addition, the SG is dominated by extremely helium-enhanced stars and, at variance with the model with MFG = 107 M⊙ of Lacchin et al. (2021), a second peak of less helium-enriched stars is formed as in model M5I24 SNe are rare and are not preventing the infall of gas like in the 107 M⊙ cluster models. Concerning iron, Figure 3 displays that SG stars are more enriched than the FG. In this model, the fewer explosions limit the iron spread in comparison to the high-mass cluster simulation of Lacchin et al. (2020), leading to a dispersion in SG of ![Mathematical equation: ${\rm\sigma^{SG}_{[Fe/H]}=0.005\ dex}$](/articles/aa/full_html/2026/04/aa54965-25/aa54965-25-eq4.png) with a mean value of −1.46 dex. To compare with present-day clusters, we assume that most FG stars have been lost during the evolution and constitute only 30% of the mass at present time, as suggested by Milone et al. (2017). Under this assumption, the iron spread of the whole cluster is estimated to be σ[Fe/H] = 0.04 dex, comparable with the bulk of GCs.
with a mean value of −1.46 dex. To compare with present-day clusters, we assume that most FG stars have been lost during the evolution and constitute only 30% of the mass at present time, as suggested by Milone et al. (2017). Under this assumption, the iron spread of the whole cluster is estimated to be σ[Fe/H] = 0.04 dex, comparable with the bulk of GCs.
 |
Fig. 2 Two-dimensional mass surface density maps of the stellar component at four evolutionary times for the M5I24 simulation on the x-y plane. |
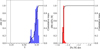 |
Fig. 3 Mass distribution of Y (left) and [Fe/H] ratio (right) of the SG stars at the same time of the profiles. The distributions have been derived by summing the stellar masses in each bin and then normalising every distribution to its maximum value. The dashed black lines represent the pristine gas composition both for Y and [Fe/H] ratio while the solid black line represents the normalised cumulative mass. |
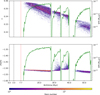 |
Fig. 4 Stellar helium mass fraction (Y) as a function of the stellar birthtime for the M5I24 model. The colour scale indicates the number of SG stars. The vertical dashed black and red lines represent the time at which the infall and the AGB ejecta start to pollute the system, respectively (see Table 2). The solid green line represents the SFR. |
3.1.2 Model M6I24
We present an analysis of a cluster characterised by a FG with a mass ten times greater (106M⊙) than that analysed in the previous section and the same pristine gas density (ρpg = 10−24 g cm−3). In contrast to the previous model, the pristine gas begins to enter the box at tinf = 12.2 Myr, with a 4.5 Myr delay after the onset of AGB ejecta at tAGB = 7.7 Myr. The figures illustrating the properties of this model are in Appendix A.
In this scenario, the cluster’s gravitational potential well is deeper than in the previous simulation. As a result, both ram pressure and the energy injection from SNe Ia are less efficient in sweeping the gas away from the cluster. This effect contributes to a more conspicuous star formation.
In Figure A.1, the gas evolution of the M6I24 model is shown. In the first snapshot, an accretion column of dense and cold gas can be distinguished downstream to the system thanks to the velocity field, while stars are formed predominantly in the very central region. At 34 Myr, the majority of the box is filled by highly pressurised, dense and hot gas, a hint of a recent SN explosion. In addition, no infalling gas is present as it has been confined out of the box. The accretion column typical of the SN-free simulations is still present but strongly affected by the explosion and no stars have recently formed along it. The last two snapshots depict very similar maps: the infall is reaching the centre of the system after a SN explosion which has heated and cleared the surroundings, the accretion column is no longer present and star formation is ongoing only in the central region. At variance with the M5I24 simulation, the stellar component is here more spherical, as a consequence of the later arrival of the infalling gas, as displayed in Figure A.2. In this model, star formation is mildly affected by the presence of Type Ia SNe, which translates into a more extended helium distribution, reported in Figure A.3, with respect both to the high-mass cluster models in Lacchin et al. (2021), due to the more efficient dilution of AGB ejecta, and to the M5I24 model, due to the lower impact of Type Ia SNe on the star formation. Even though in this model the infalling gas is able to reach the centre of the system and dilute the AGB ejecta, stars with low helium enhancement (Y<0.30) are negligible as shown in Figure A.3, at variance with the simulations without Type Ia SNe, meaning that the dilution is happening, but not as efficiently as in Yaghoobi et al. (2022a). Finally, as in the previous model, the decreasing trend in the stellar Y with time is attributed to the decreasing AGB yield over time plus the dilution of AGB ejecta with helium-poor pristine gas, which is clearly seen in Figure A.4. In a model without Type Ia SNe this drop is monotonic while here it grows again when SNe Ia are exploding. This happens because SNe confine the pristine gas far from the centre so that stars formed soon after a SN explosion are composed of AGB ejecta and, in very small amounts, of Type Ia SNe ones. Then, when the infall restarts to dilute the He-rich gas, Y goes down again. Concerning the iron composition of SG stars, the cluster’s higher mass enables the retention of more iron within its gravitational well with respect to the M5I24 model. In addition, a higher cluster mass implies a higher number of SN explosions, enhancing the amount of ejected iron later used to form new stars. Therefore, as shown in Figure A.3, the M6I24 model has a much broader dispersion of ![Mathematical equation: ${\rm \sigma^{SG}_{[Fe/H]}=0.06\, dex}$](/articles/aa/full_html/2026/04/aa54965-25/aa54965-25-eq5.png) than the M5I24 model, but also a much lower spread than the high-mass clusters model of Lacchin et al. (2021), which has ten times more SN explosions in the same timespan. Assuming that the cluster has lost most of the FG, i.e. after 12 Gyr the FG only represents the 30% of the whole cluster, we derive a total iron spread of σ[Fe/H] = 0.07 dex which is in agreement with typically observed ones (Bailin 2019).
than the M5I24 model, but also a much lower spread than the high-mass clusters model of Lacchin et al. (2021), which has ten times more SN explosions in the same timespan. Assuming that the cluster has lost most of the FG, i.e. after 12 Gyr the FG only represents the 30% of the whole cluster, we derive a total iron spread of σ[Fe/H] = 0.07 dex which is in agreement with typically observed ones (Bailin 2019).
3.2 High-density model
In this section, we present our last model, a cluster characterised by a FG with a mass of 106 M⊙ and with a pristine gas density ten times higher than previous models (ρpg = 10−23 g cm−3). The infall of pristine gas starts at tinf = 3 Myr and the onset of AGB ejecta is at tAGB = 7.7 Myr. The figures illustrating the properties of this model are in Appendix A.
In Figures A.5 and A.6, we present density, pressure, and temperature maps, along with the spatial distribution of SG stars from our M6I23 simulation. At the first snapshot (t = 17 Myr), a substantial volume within the box is occupied by infalling pristine gas, entering from the left side and moving to the right. On the right side, a notable accumulation of gas with low pressure and temperature is present, forming an accretion tail directed towards the central regions. In the central region, dense and cold gas has accumulated, distributed on an elongated shape along the x axis, corresponding to the direction of the infalling gas, as highlighted by the contours and from the stellar density distribution in Figure A.6. The stellar surface density maps reveal significant star formation with stars forming throughout the computational volume with a density peak at the very centre (Σ* > 104M⊙/pc2). At 34 Myr, similar to the previous models, we observe recent activity from a SN Ia. In this case, in particular, the SN bubble can be observed with a thin shell at high densities and pressure. The shell surrounds a nearly homogeneous cavity of low-density and highly pressurised hot gas. In the central zones, as in the 17 Myr snapshot, there is a high-pressure and cool gas filament, supplied by an elongated accretion tail along the x axis, but narrower compared to the earlier phase. Along it, stars are recently formed due to its high density. The stellar mass surface density map in Figure A.6 reveals ongoing star formation even outside the cluster centre, especially downstream of the system where the accretion column of cold and dense pristine gas is present. At the following snapshot (t = 46 Myr), the system is reaccreting infalling gas, after a momenta-neous quenching of the infall due to a SN explosion. The right side of the box displays low density and pressure, accompanied by temperatures around ∼105K. Meanwhile, the left side consists of infalling pristine gas and numerous instabilities reminiscent of the interaction of the disrupted shell with the pristine gas. As has been observed in previous snapshots, the central region of the box exhibits the highest density but it appears more compact. In the last snapshots, at 50 Myr, the system shows minimal changes. The accretion column has been disrupted by the recent SN explosion and the stellar structure has not changed significantly.
As for the other models, the infall of pristine gas is continuously limited by the expanding SN bubbles which stall well outside the cluster. Therefore, after a SN explosion and before the pristine gas is reaccreted, stars in the central region are mainly formed out of helium-rich AGB ejecta. This is clearly shown in Figure A.7 where dips in the SFR, due to SN explosions, correspond to enhancements in Y. Therefore, the distribution of the stellar Y is shifted to higher values with respect to the case without Type Ia SNe (see Yaghoobi et al. 2022a). Such behaviour is highlighted in Figure A.8, where helium-poor (Y < 0.27) stars are significantly fewer than in the model without Type Ia SNe of Yaghoobi et al. (2022a). The maximum Y is also much larger, reaching values of 0.35 during the phases in which SNe are limiting the dilution of the AGB ejecta with pristine gas (Figure A.7). The lack of helium-poor SG stars and the presence of extremely helium-enhanced stars in comparison to the models without Type Ia SNe is stressing again the limited dilution experienced by models including SN explosions. We will show in Section 4.4 that this has strong implications for the feasibility of this model.
The mass distribution of [Fe/H] has a spread of ![Mathematical equation: ${\rm\sigma^{SG}_{[Fe/H]}=0.07\ dex}$](/articles/aa/full_html/2026/04/aa54965-25/aa54965-25-eq6.png) centred at −1.46 dex, a value much smaller than what has been found for high mass clusters as a result of the lower number of Type Ia SN explosions experienced in this model. In addition, due to the smaller half-mass radius of the clusters presented here with respect to the ones of Lacchin et al. (2021), SNe ejecta can reach the outskirts and avoid being recycled to form SG stars. If we assume that most of the FG stars have been lost during the cluster’s life, accounting for 30% of the present-day cluster mass, we derive a total cluster spread in [Fe/H] of σ[Fe/H] = 0.07 dex comparable with the observed values for the bulk of GCs.
centred at −1.46 dex, a value much smaller than what has been found for high mass clusters as a result of the lower number of Type Ia SN explosions experienced in this model. In addition, due to the smaller half-mass radius of the clusters presented here with respect to the ones of Lacchin et al. (2021), SNe ejecta can reach the outskirts and avoid being recycled to form SG stars. If we assume that most of the FG stars have been lost during the cluster’s life, accounting for 30% of the present-day cluster mass, we derive a total cluster spread in [Fe/H] of σ[Fe/H] = 0.07 dex comparable with the observed values for the bulk of GCs.
4 Discussion
4.1 The Validity of the AGB scenario
The results presented in this work suggest a tension between the predicted chemical signatures of SG stars and those observed in Galactic GCs, particularly in terms of helium enrichment and dilution efficiency. This raises the question of whether the AGB scenario remains a viable framework for explaining the formation of multiple populations. While our study does not attempt to rule out alternative models, we believe that the AGB scenario still provides a physically motivated and observationally supported avenue, warranting continued refinement and testing.
The AGB stars are a natural component in self-enrichment models of GC formation. Their slow winds (on the order of ∼ 10 km s−1), rich in helium and light elements (e.g. Na, Al), offer an ideal mechanism for intra-cluster chemical evolution, especially in dense environments where SN feedback may have already cleared the primordial gas. Unlike massive stars or fast winds, AGB ejecta are more likely to remain gravitationally bound and accumulate in the cluster potential well, providing a plausible fuel source for secondary star formation (e.g. D’Ercole et al. 2008; Ventura & D’Antona 2009; D’Antona et al. 2016; Calura et al. 2019; D’Antona et al. 2023). The chemical patterns produced by AGB nucleosynthesis - namely enhanced He, N, and Na and depleted C and O - closely match the abundance trends observed in many SG stars (Gratton et al. 2019).
In addition to chemical arguments, AGB-based models have demonstrated significant success in reproducing spatial and kinematic properties of SG stars. In particular, simulations based on the AGB framework have correctly predicted the central concentration of SG stars (e.g. D’Ercole et al. 2008; Calura et al. 2019; Yaghoobi et al. 2022a), consistent with deep photometric surveys (Cordero et al. 2014; Simioni et al. 2016). Moreover, recent observational studies provide kinematic support for the scenario: SG stars have been found to exhibit faster rotation than FG stars in several clusters (e.g. NGC 2808, M13, NGC 5904, Bellini et al. 2015; Cordero et al. 2017; Cordoni et al. 2020), a pattern consistent with SG stars forming from dissipative gas flows in the inner regions of the cluster (Bellini et al. 2018; Lacchin et al. 2022; Libralato et al. 2023; Dalessandro et al. 2024; Cordoni et al. 2025). These rotation signals are difficult to explain in models where multiple populations arise purely from external accretion or stellar mergers and instead lend support to an in situ origin, possibly involving AGB ejecta.
While it is clear that the AGB scenario still faces important challenges - particularly regarding the mass budget, dilution, timing constraints, and other challenges (Bastian & Lardo 2018; Milone & Marino 2022) - its ability to qualitatively and quantitatively match many key features of GC multiple populations motivates further exploration. Rather than discarding the scenario entirely in light of the discrepancies introduced by SN Ia feedback, we argue that targeted refinements - such as more accurate treatment of gas accretion, SN delay-time distributions, or inclusion of additional feedback sources - are a more productive path forwards.
Model results.
4.2 Type Ia supernova effects of the star formation
In a previous paper (Lacchin et al. 2021), we studied the impact of Type Ia SNe on star formation and on the chemical composition of a very massive cluster in the AGB framework to determine whether the results obtained in 1D by D’Ercole et al. (2008) were the same when performing 3D hydrodynamic models. As in Calura et al. (2019), we performed simulations with different ISM densities, to explore the role played by the environment. We found that in the low-density model the SN bubbles extend much further than in the high-density one. Consequently, the ISM gas hardly ever reaches the centre of the system leading to unobserved helium spreads, while star formation is significantly reduced by the explosions. On the other side, for higher ISM densities, the SFR is not affected and a significant dilution of the AGB ejecta leads to helium spread in line with the observations. In this work, we extend the study to lowermass clusters of 105−106M⊙, with a half-mass radius of 4 pc, as expected from young massive clusters (Krumholz et al. 2019). In Table 3, we report the masses of the SG with and without Type Ia SNe for clusters from 105 M⊙ to 107 M⊙ encompassing the results obtained in this work with the ones of Calura et al. (2019), Lacchin et al. (2021) and Yaghoobi et al. (2022a). In the low-density and low-mass model (M5I24), Figure 5 shows that star formation is halted by Type Ia SN explosions, but due to the sparsity of the explosions in time, new stars are formed once the gas has cooled down again. At the end of the simulation, the total mass is 1.1 × 10³ M⊙, which corresponds to 50% of the models without Type Ia SNe. Instead, for models with 106 M⊙ the SFR is only slightly affected by SN explosions, but it is not reduced with time. At the end of the simulation, the model M6I24 has formed 3 × 10⁴ M⊙ of SG stars, which corresponds to the 61% of the same model without Type Ia SNe, while for M6I23 the final mass of SG stars is 6.7 × 10⁴M⊙, the 49% of the case without SNe.
Among the models with 106 M⊙, M6I24 shows a smaller difference between the final mass with and without SN feedback than M6I23, at variance with the case at 107 M⊙. In the models presented here, the cluster is much more compact that in Lacchin et al. (2021), with a half-mass radius almost an order of magnitude smaller. This means that, in the high-density models, the radius at which the SN bubble stalls, which depends on the density of the gas, was within the cluster in the 107 M⊙ model (see Figure 9 in Lacchin et al. 2021) while here is much larger than the cluster radius (see Figure A.5). The star formation is therefore reduced much more in the simulations performed in this work, as the whole cluster is affected by the SN explosions. In clusters with higher mass, star formation is triggered in the high-density regions at the interface between two or more expanding SN bubbles within the cluster. In addition, in M5I23, the infall of ISM gas is limited by SN explosions, reducing the amount of pristine gas in the central regions, similarly to what was happening in the low-density model with MFG = 107M⊙ . At around 40Myr the presence of SNe exploding at short time separations is preventing the infalling gas from reaching the central part of the system, and therefore new stars are born only from AGB ejecta, as visible in Figure A.7. The similar SFR experienced by models M6I23 and M6I4 at 40 Myr and later at around 48 Myr confirms this behaviour.
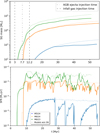 |
Fig. 5 Upper panel: evolution of the SG stellar mass with time. Lower panel: evolution of the SFR with time. Solid lines represent models with Type Ia SNe, whereas dotted lines of the same colour represent the same models but without Type Ia SNe. The blue lines represent the low-mass low-density model while the orange and green lines represent the highmass low- and high-density models, respectively. In the upper panel, the dashed lines show the times at which the infall enters the box, which depends on the model as reported in Table 2. The dash-dotted line displays the beginning of the injection of AGB ejecta, which is the same for all models. |
4.3 The timing and spatial distribution of Type Ia Supernovae
In our models, Type Ia supernovae (SNe Ia) are assumed to follow the delay-time distribution (DTD) derived by Greggio (2005) for the single-degenerate (SD) scenario. As described in Section 2.4, this results in the onset of SNe Ia roughly contemporaneously with the beginning of AGB ejecta release, i.e. ∼39 Myr after the formation of the FG of stars. The integrated number of explosions in our simulations - about 10 for a cluster with 105 M⊙ and 100 for one with 106 M⊙ - reflects this early burst of activity. While this approach has been adopted in previous works, we acknowledge that it may not accurately reflect the physical conditions of low-metallicity GCs.
In particular, the early emergence of SNe Ia in our models tends to suppress the standard pathway of SG formation, in which AGB ejecta are diluted by infalling pristine gas. Since SNe Ia begin exploding as soon as the AGB winds are released, they inhibit the cooling and settling of ambient material before a typical SG can form. This overlap is especially problematic given that the SD channel relies on mass accretion onto white dwarfs - a process that is highly sensitive to metallicity through the formation of optically thick winds (Kobayashi et al. 1998). These winds are required to maintain accretion within the narrow range necessary for a white dwarf to reach the Chandrasekhar mass and explode. In low-metallicity environments like those typical of GCs (Z ≲ 0.001), such winds are strongly suppressed, and hence the SD channel is expected to be significantly delayed or even inefficient.
Kobayashi et al. (2020) studied the dependence of DTD on metallicity, finding that for Z = 0.004 - already higher than most GC metallicities - the DTD begins at log(age) ∼ 8.25 (i.e. ≳180 Myr), i.e. significantly after the AGB pollution phase. This would naturally leave room for the canonical SG formation process to unfold without interference from SNe Ia in the early stages. These considerations suggest that our assumption of a prompt SD channel may overestimate the dynamical impact of SNe Ia in the early evolution of GCs.
An alternative scenario involves the double-degenerate (DD) channel, in which two white dwarfs merge. This channel is thought to dominate at early times in low-metallicity systems and may begin earlier than the SD route. Moreover, it may be that both SD and DD progenitors are more centrally concentrated than what assumed here, due to mass segregation and dynamical interactions (Voss & Nelemans 2012). If this is the case, their explosions would inject energy into a smaller volume, potentially affecting only the central region while leaving the outer layers -and possibly even the cooling inflow - relatively undisturbed.
D’Ercole et al. (2008) used 1D hydrodynamical simulations to show that centrally located SNe Ia can quickly quench SG star formation by expelling gas from the cluster core. While insightful, such 1D models necessarily neglect anisotropies, clumpiness, and angular momentum effects that are important in 3D. It would therefore be valuable to revisit this configuration using high-resolution 3D simulations to assess whether centrally concentrated SNe Ia retain the same quenching efficiency under more realistic geometric and dynamical conditions.
Moreover, the detailed impact of DD SNe Ia on cluster gas dynamics has not been fully explored, and future simulations should account for their spatial and time distribution and energetics in a realistic way.
Finally, we highlight an important asymmetry in our current results: while SNe Ia in our simulations are generally effective at halting the infall of pristine gas, they are not always successful at quenching star formation from the accumulated material.
This might suggest that the assumed energy deposition is too diffuse, or alternatively, that additional concentrated feedback mechanisms (e.g. X-ray binaries, pulsar winds; see Section 4.6) may be needed to suppress residual star formation.
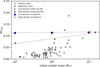 |
Fig. 6 Maximum enhancement of the helium mass fraction in SG stars as a function of initial cluster mass. Diamonds represent models without Type Ia SNe from Calura et al. (2019) and Yaghoobi et al. (2022a): filled diamonds represent the high-density models, while empty ones the low-density models. The data for the models with Type Ia SNe with the highest initial cluster masses are taken from Lacchin et al. (2021). Open circles and squares are observational data obtained by Milone et al. (2020) for the Milky Way and Magellanic Clouds clusters (initial masses of each cluster are from Baumgardt & Hilker 2018 and Goudfrooij et al. 2014.) |
4.4 He enrichment of second-generation stars
In the last decade, the Hubble Space Telescope photometry has allowed us to derive the helium composition in several GC stars, both in the Milky Way and in Magellanic Clouds (Milone et al. 2015; Marino et al. 2018; Lagioia et al. 2018, 2019; Milone et al. 2020) revealing a correlation between the maximum He spread δYmαx and both the present and initial cluster mass (Milone et al. 2018; Zennaro et al. 2019; Milone et al. 2020). Therefore, massive clusters have been found to display larger He enhancements a trend that has been found in Yaghoobi et al. (2022a) for the high-density models. Figure 6 shows the maximum He spread among both FG and SG stars δYmax = Ymax - Y0, where Ymax is the maximum He mass fraction in the cluster and Y0 the He mass fraction of the FG stars, as a function of initial cluster mass for both the models with (this work and Lacchin et al. 2021) and without (Yaghoobi et al. 2022a and Calura et al. 2019) SNe Ia. In the low-density models, the δYmax is independent of the cluster mass, as it has been found even in the simulations without Type Ia SNe as most of the SG stars are formed out of undiluted AGB ejecta. Once we include SNe Ia, the infall of ISM gas is reduced even more leading to the formation of a higher number of stars from undiluted material. As the AGB yields do not depend on the cluster mass, the first stars formed have a helium mass fraction around Y ~ 0.36 in all models. In high-density models without Type Ia SNe, instead, a correlation with cluster mass was found as the majority of the material composing SG stars was coming from pristine gas. On the other hand, when Type Ia SNe are added, even the high-density models show no dependence on the cluster mass, as in the low-density ones. SN explosions together with reducing the SFR, are preventing the infall of pristine gas, and therefore stars that are formed after the SN explosion and before the pristine gas has time to reach again the central regions would be mainly composed of AGB ejecta, significantly increasing the Y in SG stars. Such enhancement can be clearly seen in Figure A.7, where peaks of Y correspond to decreasing SFR due to Type Ia SN explosions.
4.5 Iron enrichment
The total iron spread does not vary much in clusters with the same mass and different ISM density. The iron rich stars are formed soon after a decrease in the SFR before the AGB ejecta and the pristine gas restart to pollute the system as shown in Figures A.4 and A.7. The peaks in the [Fe/H] are decreasing fast over time, as AGB material dilutes SN ejecta.
Concerning the iron content in SG stars only, the dispersions are much smaller than the ones obtained in the 107M⊙ clusters due to the fewer SN explosions. Observationally, more attention has been given to FG stars where an iron spread has been detected in several clusters (Legnardi et al. 2022; Lardo et al. 2022, 2023). On the other side, the SG spread is much more difficult to derive: Legnardi et al. (2022) compared the two populations for a few clusters finding that the SG is more homogeneous in iron than the FG. In all our clusters the spread of both the SG only and the whole cluster is small, in agreement with the current observations (Bailin 2019). Nevertheless, in every model presented here, the FG is assumed to be homogeneous in the iron content; therefore, it is likely that having a spread in the FG iron composition would lead to a broader SG one, perhaps larger than the typical ones.
In all the models, SG stars are found to be more iron-rich than FG stars. When considering the iron dispersion of the whole cluster assuming that most of the FG stars have been lost to match the present-day fraction of SG stars, no significant variations have been found with respect to the dispersion of the SG only.
4.6 Additional sources of energy influencing star formation quenching
While Type Ia SNe are a key source of feedback in our models, other astrophysical processes may significantly contribute to the quenching of SG star formation in GCs. Below we discuss a number of other possible mechanisms, supported by recent literature, that could provide additional energy input-either preventing the accretion of pristine gas or disrupting star-forming regions.
4.6.1 Photoionising radiation
Massive stars and post-AGB objects emit substantial ultraviolet radiation capable of ionising the surrounding medium. Such ionising radiation emitted by evolved stars has been proposed as a fundamental ingredient to explain the very small content of ionised gas of GCs at the present-day (Chantereau et al. 2020). As for young clusters, recent simulations by Yaghoobi et al. (2024) suggest that photoionising radiation alone can suppress cooling flows in low-mass clusters, especially in systems where the potential well is shallow. These authors find that in most configurations - except for the most massive clusters (with stellar mass >106 M⊙, see also Yaghoobi et al. 2022a) - the gas remains too hot and diffuse to trigger SG star formation. They also suggest that in the local Universe, the ionising luminosity from a modest population of post-main-sequence stars (QH ~ 1046−1047 s−1 M⊙⊙−1) in low-mass young clusters may maintain the interstellar medium (ISM) at temperatures T ~ 104−105 K stalling further collapse and preventing star formation. That explains why local young clusters do not show evidence of ongoing star formation and why they are free of cold gas. However, due to a more significant population of massive clusters and larger reservoir of dense gas, the same may not be true in high-redshift galaxies (Yaghoobi et al. 2024).
4.6.2 X-ray binaries
X-ray binaries - especially high-mass systems formed early in cluster evolution, after the collapse of massive stars, generally named high-mass X-ray binaries (Fornasini et al. 2023) - can inject energy into the ambient gas through both hard X-ray radiation and mechanical feedback from jets or winds. Power et al. (2009) have argued that their collective feedback, particularly if concentrated in the central region, could heat or expel gas in systems with shallow gravitational wells, giving a significant contribution to the high-redshift X-ray background. The total energy output from a single, bright low-mass X-ray binary over a few million years can reach ∼1O49−1O50 erg, in some cases comparable to the cumulative energy emitted by a massive star via stellar winds (Calura et al. 2015, 2025). Fifty to a hundred million years after their formation, their luminosity has decreased progressively of several orders of magnitude Power et al. (2009); still, they could play and important role at preventing further accretion in evolved systems D’Ercole et al. (2008).
4.6.3 Pulsar winds
Millisecond pulsars are ubiquitous in GCs and may give a non-negligible contribution to long-term stellar feedback. Through magnetised winds and relativistic particles, they can inflate bubbles and inject non-thermal pressure into the ISM. With typical X-ray luminosities of 1033−1034 erg/s, their cumulative energy release is lower than the one of other sources such as X-ray binaries and their radial distribution indicates a typical higher concentration in the cluster centre (Ye et al. 2019). However, considering the ubiquitous presence and continuous nature of these sources, they may contribute in a non-negligible fashion to regulating central gas accretion in GCs.
4.6.4 Planetary nebulae
In their late planetary nebula phases, red giant stars emit shells of ionised gas that may affect the interstellar and intracluster gas. Although less energetic than the sources above, the fast winds of planetary nebulae (PNe) can provide local pressure support. Their terminal velocities (v ∼ 100-1000 km s−1, Grewing 1989) and short durations (t ~ 1O4 yr) Badenes et al. (2015) yield energy releases of ∼1033−1037 erg per event (Schönberner et al. 2014; Tan et al. 2024). In principle, if occurring in large numbers, these events can perturb local gas structure and reduce the effectiveness of inflowing streams and thus with potential effects on the late star formation history of a star cluster. Their progenitors are intermediate-mass stars; therefore, the youngest PNe can occur on timescales ranging from ∼40 Myr to several hundred million years and represent a diffuse source. Based on present estimates, their cumulative effect is likely subdominant compared to SNe or X-ray binaries D’Ercole et al. (2008), but they can play some role to explain the loss of the intracluster medium in old (from approximately a few gigayears) GCs.
Despite the growing recognition of the importance of these additional energy sources, their implementation in present-day simulations of GC formation remains partial and fragmented. Most studies to date have explored these mechanisms in isolation, often using simplified prescriptions for their energy injection and without accounting for their spatial clustering or temporal evolution. Furthermore, the possible interplay among different feedback channels - such as the combined effect of SNe Ia, X-ray binaries, and pulsar winds - has not been systematically investigated. Future high-resolution simulations should aim to incorporate these processes simultaneously, with physically motivated models for their spatial distribution, duty cycles, and feedback efficiency. Only through such comprehensive approaches can we fully understand the range of pathways leading to the formation (or suppression) of SG stars in GCs.
5 Conclusions
By means of 3D hydrodynamic simulations, we explored the role of Type Ia SNe on the formation of SG stars in GCs of 105−106M⊙ and surrounded by a uniform interstellar medium of 10−23−10−24 g cm−3. We focused on the ability of Type Ia SNe to quench the star formation and on the chemical composition of newborn SG stars. In all models, we assume that the SG are formed out of the ejecta of FG AGB stars plus ISM gas which is supposed to dilute the AGB ejecta to recall the anti-correlations observed in GCs. As has been shown by Lacchin et al. (2021), dilution can be significantly reduced by the presence of Type Ia SNe in massive systems, leading to clusters composed of extremely helium-rich stars, at variance with observations. Even though the number of exploding SN Ia is small, given the lower mass of the clusters studied here, the shallower potential well of the FG reduces the amount of pristine gas that can be accreted and dilute the AGB ejecta.
Our results can be summarised as follows:
In the 105M⊙ cluster, the SFR is strongly affected by the presence of Type Ia SNe, with quenching events every time a SN explodes. However, given the few explosions, star formation restarts once the gas cools down again. On the other side, for clusters with a mass of 106M⊙ the SFR is mildly affected by Type Ia SNe, without a proper quenching of SF but with SFR decreases when SNe Ia explode;
The iron spread in all our models is much smaller than the one derived in Lacchin et al. (2021) due to the lower number of SNe Ia explosions. In this case, the iron content in SG, as well as for the whole cluster, is more in line with what is observed;
As in the more massive cluster simulations of Lacchin et al. (2021), Type Ia SNe limit the dilution of the AGB ejecta with pristine gas falling into the system. Therefore, even in the models presented here, the helium mass fraction, Y, of SG stars is on average much higher than the one found in simulations without Type Ia SN feedback by Yaghoobi et al. (2022a). Such behaviour has dramatic effects on the highest helium mass fraction in stars, which significantly increases especially in the high-density models. Therefore, the maximum enhancement of helium mass fraction, δYmax, is above 0.1 even for low mass clusters, where, instead, without Type Ia SN a correlation was found with initial cluster mass. With SNe Ia explosions this trend is no more visible and at all cluster masses δYmax is comparable with the difference between the most massive AGB ejecta, Y ~ 0.36, and the primordial one of 0.246.
Combining the results we obtain here with the ones obtained by Lacchin et al. (2021), we can conclude Type Ia SN feedback alone does not immediately quench the star formation as previously thought, and, moreover, it leads to unobserved chemical compositions due to the significant reduction of the dilution which is instead necessary to reproduce the anti-correlations detected in GCs. Recently, Yaghoobi et al. (2024) (but see also Chantereau et al. 2020) have found that photoionising radiation can deeply affect star formation in low-mass clusters like the ones we study in this work. In their paper, they found that only in the M6I23 model SG stars can form, while for all other models ionising radiation heats and expands the gas preventing it from forming a cooling flow and reaching high enough densities to be eligible for SF. Nevertheless, not even assuming photoionising radiation clusters can quench or significantly reduce the SG formation within a hundred million years. Other mechanisms should be invoked to explain how the SG formation is halted, such as X-ray binaries, planetary nebulae (D’Ercole et al. 2008), or pulsar-winds (Krause et al. 2016). Such processes act at the same time, so modelling them and studying their interplay is essential to reach clearer insights into the formation of SG stars, but also on the GC journey to become gas-free systems.
Acknowledgements
EL acknowledges financial support from the European Research Council for the ERC Consolidator grant DEMOBLACK, under contract no. 770017. FC acknowledges support from the 2023 INAF Mini-Grant ‘Clumps at cosmological distance: revealing their formation, nature, and evolution, (1.05.23.04.01). The research activities described in this paper have been co-funded by the European Union - NextGeneration EU within PRIN 2022 project no. 20229YBSAN - Globular clusters in cosmological simulations and in lensed fields: from their birth to the present epoch. We acknowledge EuroHPC Joint Undertaking for awarding us access to Discoverer at SofiaTech, Bulgaria.
References
- Badenes, C., Maoz, D., & Ciardullo, R. 2015, ApJ, 804, L25 [NASA ADS] [CrossRef] [Google Scholar]
- Bailin, J. 2019, ApJS, 245, 5 [NASA ADS] [CrossRef] [Google Scholar]
- Bastian, N., & Lardo, C. 2018, ARA&A, 56, 83 [Google Scholar]
- Baumgardt, H., & Hilker, M. 2018, MNRAS, 478, 1520 [Google Scholar]
- Bekki, K. 2011, MNRAS, 412, 2241 [NASA ADS] [CrossRef] [Google Scholar]
- Bellini, A., Vesperini, E., Piotto, G., et al. 2015, ApJ, 810, L13 [NASA ADS] [CrossRef] [Google Scholar]
- Bellini, A., Libralato, M., Bedin, L. R., et al. 2018, ApJ, 853, 86 [NASA ADS] [CrossRef] [Google Scholar]
- Blondin, S. 2024, arXiv e-prints [arXiv:2411.09740] [Google Scholar]
- Breen, P. G. 2018, MNRAS, 481, L110 [NASA ADS] [CrossRef] [Google Scholar]
- Calura, F., Few, C. G., Romano, D., & D’Ercole, A. 2015, ApJ, 814, L14 [NASA ADS] [CrossRef] [Google Scholar]
- Calura, F., D’Ercole, A., Vesperini, E., Vanzella, E., & Sollima, A. 2019, MNRAS, 489, 3269 [Google Scholar]
- Calura, F., Pascale, R., Agertz, O., et al. 2025, A&A, 698, A207 [NASA ADS] [CrossRef] [EDP Sciences] [Google Scholar]
- Carretta, E., Bragaglia, A., Gratton, R., D’Orazi, V., & Lucatello, S. 2009a, A&A, 508, 695 [NASA ADS] [CrossRef] [EDP Sciences] [Google Scholar]
- Carretta, E., Bragaglia, A., Gratton, R., & Lucatello, S. 2009b, A&A, 505, 139 [NASA ADS] [CrossRef] [EDP Sciences] [Google Scholar]
- Carretta, E., Bragaglia, A., Gratton, R. G., et al. 2009c, A&A, 505, 117 [NASA ADS] [CrossRef] [EDP Sciences] [Google Scholar]
- Chantereau, W., Biernacki, P., Martig, M., et al. 2020, MNRAS, 493, 1306 [NASA ADS] [CrossRef] [Google Scholar]
- Cordero, M. J., Pilachowski, C. A., Johnson, C. I., et al. 2014, ApJ, 780, 94 [Google Scholar]
- Cordero, M. J., Hénault-Brunet, V., Pilachowski, C. A., et al. 2017, MNRAS, 465, 3515 [NASA ADS] [CrossRef] [Google Scholar]
- Cordoni, G., Milone, A. P., Mastrobuono-Battisti, A., et al. 2020, ApJ, 889, 18 [Google Scholar]
- Cordoni, G., Casagrande, L., Milone, A. P., et al. 2025, MNRAS, 537, 2342 [Google Scholar]
- Dalessandro, E., Cadelano, M., Della Croce, A., et al. 2024, A&A, 691, A94 [NASA ADS] [CrossRef] [EDP Sciences] [Google Scholar]
- D’Antona, F., & Caloi, V. 2004, ApJ, 611, 871 [Google Scholar]
- D’Antona, F., Vesperini, E., D’Ercole, A., et al. 2016, MNRAS, 458, 2122 [Google Scholar]
- D’Antona, F., Vesperini, E., Calura, F., et al. 2023, A&A, 680, L19 [NASA ADS] [CrossRef] [EDP Sciences] [Google Scholar]
- de Mink, S. E., Pols, O. R., Langer, N., & Izzard, R. G. 2009, A&A, 507, L1 [NASA ADS] [CrossRef] [EDP Sciences] [Google Scholar]
- Decressin, T., Charbonnel, C., & Meynet, G. 2007, A&A, 475, 859 [CrossRef] [EDP Sciences] [Google Scholar]
- Denissenkov, P. A., & Hartwick, F. D. A. 2014, MNRAS, 437, L21 [Google Scholar]
- D’Ercole, A., Vesperini, E., D’Antona, F., McMillan, S. L. W., & Recchi, S. 2008, MNRAS, 391, 825 [CrossRef] [Google Scholar]
- D’Ercole, A., D’Antona, F., Ventura, P., Vesperini, E., & McMillan, S. L. W. 2010, MNRAS, 407, 854 [Google Scholar]
- D’Ercole, A., D’Antona, F., Carini, R., Vesperini, E., & Ventura, P. 2012, MNRAS, 423, 1521 [Google Scholar]
- D’Ercole, A., D’Antona, F., & Vesperini, E. 2016, MNRAS, 461, 4088 [Google Scholar]
- Few, C. G., Courty, S., Gibson, B. K., Michel-Dansac, L., & Calura, F. 2014, MNRAS, 444, 3845 [NASA ADS] [CrossRef] [Google Scholar]
- Fornasini, F., Antoniou, V., & Dubus, G. 2023, in Handbook of X-ray and Gamma-ray Astrophysics, 143 [Google Scholar]
- Gieles, M., Charbonnel, C., Krause, M. G. H., et al. 2018, MNRAS, 478, 2461 [Google Scholar]
- Goudfrooij, P., Girardi, L., Kozhurina-Platais, V., et al. 2014, ApJ, 797, 35 [CrossRef] [Google Scholar]
- Gratton, R., Bragaglia, A., Carretta, E., et al. 2019, A&A Rev., 27, 8 [Google Scholar]
- Greggio, L. 2005, A&A, 441, 1055 [NASA ADS] [CrossRef] [EDP Sciences] [Google Scholar]
- Grewing, M. 1989, in IAU Symposium, 131, Planetary Nebulae, ed. S. Torres-Peimbert, 241 [Google Scholar]
- Haffner, L. M., Dettmar, R. J., Beckman, J. E., et al. 2009, Rev. Mod. Phys., 81, 969 [CrossRef] [Google Scholar]
- Johnson, C. I., Rich, R. M., Pilachowski, C. A., et al. 2015, AJ, 150, 63 [NASA ADS] [CrossRef] [Google Scholar]
- Kim, C.-G., & Ostriker, E. C. 2015, ApJ, 802, 99 [NASA ADS] [CrossRef] [Google Scholar]
- Kobayashi, C., Tsujimoto, T., Nomoto, K., Hachisu, I., & Kato, M. 1998, ApJ, 503, L155 [NASA ADS] [CrossRef] [Google Scholar]
- Kobayashi, C., Leung, S.-C., & Nomoto, K. 2020, ApJ, 895, 138 [CrossRef] [Google Scholar]
- Krause, M. G. H., Charbonnel, C., Bastian, N., & Diehl, R. 2016, A&A, 587, A53 [NASA ADS] [CrossRef] [EDP Sciences] [Google Scholar]
- Kroupa, P. 2001, MNRAS, 322, 231 [NASA ADS] [CrossRef] [Google Scholar]
- Krumholz, M. R., McKee, C. F., & Bland-Hawthorn, J. 2019, ARA&A, 57, 227 [Google Scholar]
- Lacchin, E., Matteucci, F., Vincenzo, F., & Palla, M. 2020, MNRAS, 495, 3276 [Google Scholar]
- Lacchin, E., Calura, F., & Vesperini, E. 2021, MNRAS, 506, 5951 [NASA ADS] [CrossRef] [Google Scholar]
- Lacchin, E., Calura, F., Vesperini, E., & Mastrobuono-Battisti, A. 2022, MNRAS, 517, 1171 [NASA ADS] [CrossRef] [Google Scholar]
- Lagioia, E. P., Milone, A. P., Marino, A. F., et al. 2018, MNRAS, 475, 4088 [CrossRef] [Google Scholar]
- Lagioia, E. P., Milone, A. P., Marino, A. F., & Dotter, A. 2019, ApJ, 871, 140 [NASA ADS] [CrossRef] [Google Scholar]
- Lardo, C., Salaris, M., Cassisi, S., & Bastian, N. 2022, A&A, 662, A117 [NASA ADS] [CrossRef] [EDP Sciences] [Google Scholar]
- Lardo, C., Salaris, M., Cassisi, S., et al. 2023, A&A, 669, A19 [NASA ADS] [CrossRef] [EDP Sciences] [Google Scholar]
- Larsen, S. S., Brodie, J. P., Grundahl, F., & Strader, J. 2014, ApJ, 797, 15 [NASA ADS] [CrossRef] [Google Scholar]
- Lee, Y. W., Joo, J. M., Sohn, Y. J., et al. 1999, Nature, 402, 55 [Google Scholar]
- Legnardi, M. V., Milone, A. P., Armillotta, L., et al. 2022, MNRAS, 513, 735 [NASA ADS] [CrossRef] [Google Scholar]
- Libralato, M., Vesperini, E., Bellini, A., et al. 2023, ApJ, 944, 58 [CrossRef] [Google Scholar]
- Marcolini, A., Brighenti, F., & D’Ercole, A. 2003, MNRAS, 345, 1329 [Google Scholar]
- Marino, A. F., Villanova, S., Piotto, G., et al. 2008, A&A, 490, 625 [NASA ADS] [CrossRef] [EDP Sciences] [Google Scholar]
- Marino, A. F., Yong, D., Milone, A. P., et al. 2018, ApJ, 859, 81 [NASA ADS] [CrossRef] [Google Scholar]
- Marino, A. F., Milone, A. P., Renzini, A., et al. 2019, MNRAS, 487, 3815 [CrossRef] [Google Scholar]
- McKenzie, M., & Bekki, K. 2021, MNRAS, 500, 4578 [Google Scholar]
- Milone, A. P., & Marino, A. F. 2022, Universe, 8, 359 [NASA ADS] [CrossRef] [Google Scholar]
- Milone, A. P., Piotto, G., Bedin, L. R., et al. 2012, A&A, 540, A16 [NASA ADS] [CrossRef] [EDP Sciences] [Google Scholar]
- Milone, A. P., Marino, A. F., Piotto, G., et al. 2015, ApJ, 808, 51 [NASA ADS] [CrossRef] [Google Scholar]
- Milone, A. P., Piotto, G., Renzini, A., et al. 2017, MNRAS, 464, 3636 [Google Scholar]
- Milone, A. P., Marino, A. F., Renzini, A., et al. 2018, MNRAS, 481, 5098 [NASA ADS] [CrossRef] [Google Scholar]
- Milone, A. P., Marino, A. F., Da Costa, G. S., et al. 2020, MNRAS, 491, 515 [NASA ADS] [CrossRef] [Google Scholar]
- Mucciarelli, A., Origlia, L., Ferraro, F. R., & Pancino, E. 2009, ApJ, 695, L134 [NASA ADS] [CrossRef] [Google Scholar]
- Nardiello, D., Piotto, G., Milone, A. P., et al. 2019, MNRAS, 485, 3076 [NASA ADS] [CrossRef] [Google Scholar]
- Pancino, E., Ferraro, F. R., Bellazzini, M., Piotto, G., & Zoccali, M. 2000, ApJ, 534, L83 [NASA ADS] [CrossRef] [Google Scholar]
- Piotto, G., Villanova, S., Bedin, L. R., et al. 2005, ApJ, 621, 777 [Google Scholar]
- Plummer, H. C. 1911, MNRAS, 71, 460 [Google Scholar]
- Power, C., Wynn, G. A., Combet, C., & Wilkinson, M. I. 2009, MNRAS, 395, 1146 [Google Scholar]
- Rasera, Y., & Teyssier, R. 2006, A&A, 445, 1 [NASA ADS] [CrossRef] [EDP Sciences] [Google Scholar]
- Renzini, A., D’Antona, F., Cassisi, S., et al. 2015, MNRAS, 454, 4197 [Google Scholar]
- Scalzo, R. A., Ruiter, A. J., & Sim, S. A. 2014, MNRAS, 445, 2535 [NASA ADS] [CrossRef] [Google Scholar]
- Schmidt, M. 1959, ApJ, 129, 243 [NASA ADS] [CrossRef] [Google Scholar]
- Schönberner, D., Jacob, R., Lehmann, H., et al. 2014, Astron. Nachr., 335, 378 [CrossRef] [Google Scholar]
- Simioni, M., Milone, A. P., Bedin, L. R., et al. 2016, MNRAS, 463, 449 [NASA ADS] [CrossRef] [Google Scholar]
- Szécsi, D., Mackey, J., & Langer, N. 2018, A&A, 612, A55 [NASA ADS] [CrossRef] [EDP Sciences] [Google Scholar]
- Tan, S., Parker, Q. A., Zijlstra, A. A., & Rees, B. 2024, MNRAS, 527, 6363 [Google Scholar]
- Teyssier, R. 2002, A&A, 385, 337 [CrossRef] [EDP Sciences] [Google Scholar]
- Ventura, P., & D’Antona, F. 2009, A&A, 499, 835 [NASA ADS] [CrossRef] [EDP Sciences] [Google Scholar]
- Vink, J. S. 2018, A&A, 615, A119 [NASA ADS] [CrossRef] [EDP Sciences] [Google Scholar]
- Voss, R., & Nelemans, G. 2012, A&A, 539, A77 [NASA ADS] [CrossRef] [EDP Sciences] [Google Scholar]
- Wang, L., Kroupa, P., Takahashi, K., & Jerabkova, T. 2020, MNRAS, 491, 440 [Google Scholar]
- Wardlow, J. L., Cooray, A., Osage, W., et al. 2017, ApJ, 837, 12 [NASA ADS] [CrossRef] [Google Scholar]
- Yaghoobi, A., Calura, F., Rosdahl, J., & Haghi, H. 2022a, MNRAS, 510, 4330 [NASA ADS] [CrossRef] [Google Scholar]
- Yaghoobi, A., Rosdahl, J., Calura, F., Khalaj, P., & Haghi, H. 2022b, MNRAS, 517, 4175 [CrossRef] [Google Scholar]
- Yaghoobi, A., Rosdahl, J., Calura, F., & Ataiee, S. 2024, MNRAS, 528, 5477 [Google Scholar]
- Ye, C. S., Kremer, K., Chatterjee, S., Rodriguez, C. L., & Rasio, F. A. 2019, ApJ, 877, 122 [NASA ADS] [CrossRef] [Google Scholar]
- Zennaro, M., Milone, A. P., Marino, A. F., et al. 2019, MNRAS, 487, 3239 [CrossRef] [Google Scholar]
Appendix A Additional simulation figures
In this appendix, we present supplementary maps and diagnostic plots supporting the analysis described in Sect. 3.
All Tables
All Figures
|
Fig. 1 Two-dimensional maps of the gas density (left-hand panels) and of the temperature (central panels) and the pressure (right-hand panels) on the x-y plane for the M5I24 simulation. The corresponding evolutionary time of each set of panels is reported in the density map, together with the velocity field denoted by the white arrows (all arrows have the same length, so no information on the intensity of the field is reported), and the contours describing the region enclosing the 75% and 95% of the SG mass in red and black, respectively. The cyan points on the temperature map represent newborn stars (age <0.05 Myr). |
| In the text | |
|
Fig. 2 Two-dimensional mass surface density maps of the stellar component at four evolutionary times for the M5I24 simulation on the x-y plane. |
| In the text | |
|
Fig. 3 Mass distribution of Y (left) and [Fe/H] ratio (right) of the SG stars at the same time of the profiles. The distributions have been derived by summing the stellar masses in each bin and then normalising every distribution to its maximum value. The dashed black lines represent the pristine gas composition both for Y and [Fe/H] ratio while the solid black line represents the normalised cumulative mass. |
| In the text | |
|
Fig. 4 Stellar helium mass fraction (Y) as a function of the stellar birthtime for the M5I24 model. The colour scale indicates the number of SG stars. The vertical dashed black and red lines represent the time at which the infall and the AGB ejecta start to pollute the system, respectively (see Table 2). The solid green line represents the SFR. |
| In the text | |
|
Fig. 5 Upper panel: evolution of the SG stellar mass with time. Lower panel: evolution of the SFR with time. Solid lines represent models with Type Ia SNe, whereas dotted lines of the same colour represent the same models but without Type Ia SNe. The blue lines represent the low-mass low-density model while the orange and green lines represent the highmass low- and high-density models, respectively. In the upper panel, the dashed lines show the times at which the infall enters the box, which depends on the model as reported in Table 2. The dash-dotted line displays the beginning of the injection of AGB ejecta, which is the same for all models. |
| In the text | |
|
Fig. 6 Maximum enhancement of the helium mass fraction in SG stars as a function of initial cluster mass. Diamonds represent models without Type Ia SNe from Calura et al. (2019) and Yaghoobi et al. (2022a): filled diamonds represent the high-density models, while empty ones the low-density models. The data for the models with Type Ia SNe with the highest initial cluster masses are taken from Lacchin et al. (2021). Open circles and squares are observational data obtained by Milone et al. (2020) for the Milky Way and Magellanic Clouds clusters (initial masses of each cluster are from Baumgardt & Hilker 2018 and Goudfrooij et al. 2014.) |
| In the text | |
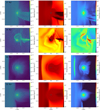 |
Fig. A.1 Same as Figure 1, but for model M6I24. |
| In the text | |
 |
Fig. A.2 Same as Figure 2, but for model M6I24. |
| In the text | |
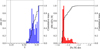 |
Fig. A.3 Same as Figure 3, but for model M6I24 at 55 Myr. |
| In the text | |
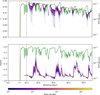 |
Fig. A.4 Same as Figure 4, but for model M6I24. |
| In the text | |
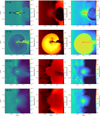 |
Fig. A.5 Same as Figure 1, but for model M6I23. |
| In the text | |
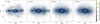 |
Fig. A.6 Same as Figure 2, but for model M6I23. |
| In the text | |
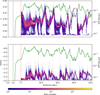 |
Fig. A.7 Same as Figure 4, but for model M6I23. |
| In the text | |
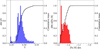 |
Fig. A.8 Same as Figure 3, but for model M6I23 at 50 Myr. |
| In the text | |
Current usage metrics show cumulative count of Article Views (full-text article views including HTML views, PDF and ePub downloads, according to the available data) and Abstracts Views on Vision4Press platform.
Data correspond to usage on the plateform after 2015. The current usage metrics is available 48-96 hours after online publication and is updated daily on week days.
Initial download of the metrics may take a while.