Fig. 4
Download original image
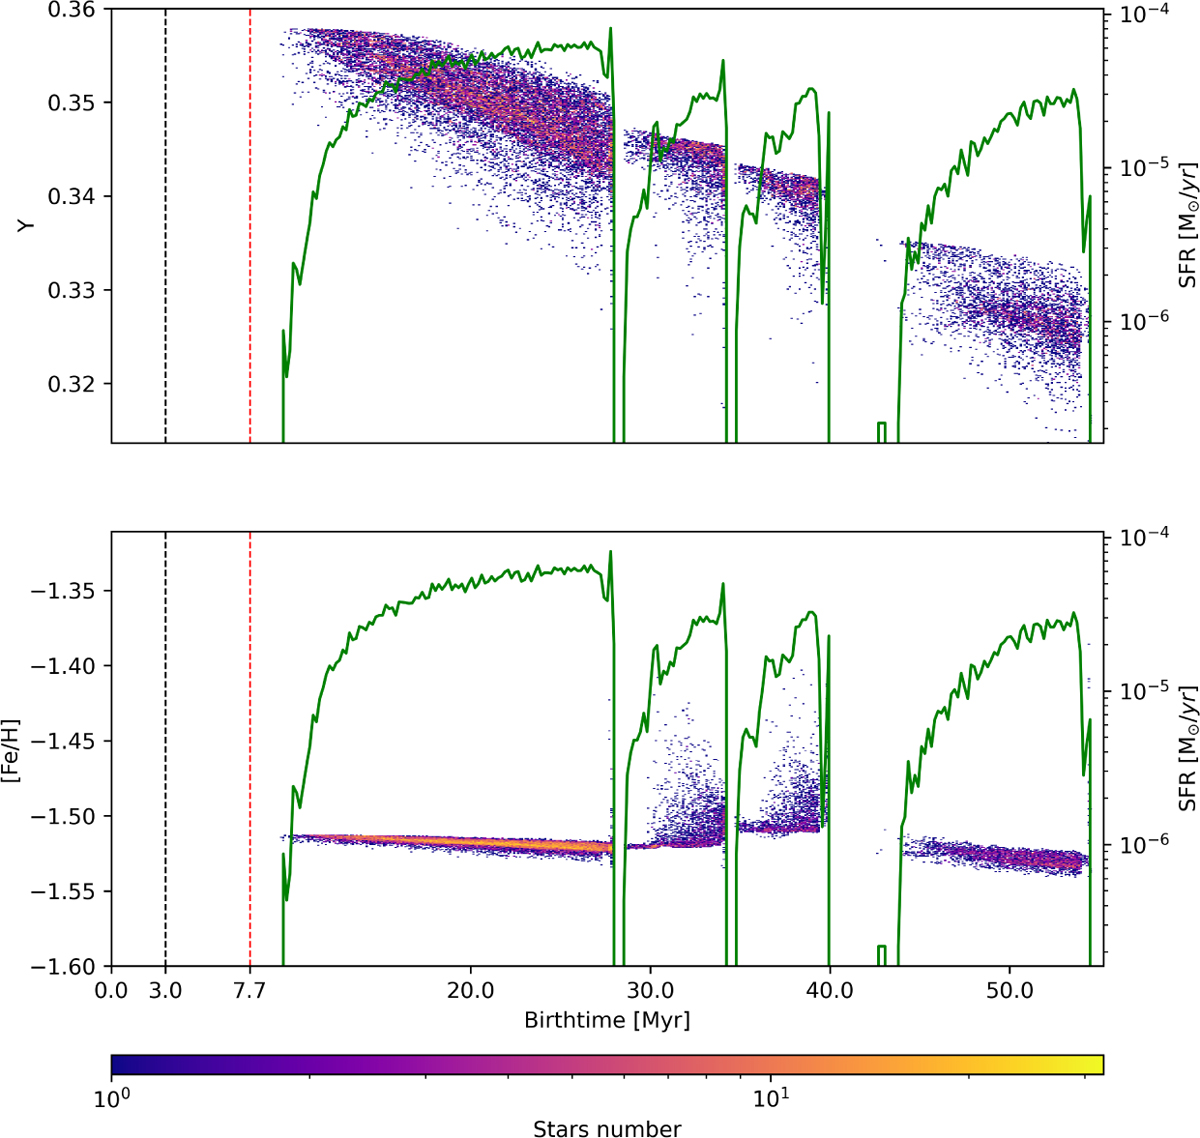
Stellar helium mass fraction (Y) as a function of the stellar birthtime for the M5I24 model. The colour scale indicates the number of SG stars. The vertical dashed black and red lines represent the time at which the infall and the AGB ejecta start to pollute the system, respectively (see Table 2). The solid green line represents the SFR.
Current usage metrics show cumulative count of Article Views (full-text article views including HTML views, PDF and ePub downloads, according to the available data) and Abstracts Views on Vision4Press platform.
Data correspond to usage on the plateform after 2015. The current usage metrics is available 48-96 hours after online publication and is updated daily on week days.
Initial download of the metrics may take a while.