Fig. 5
Download original image
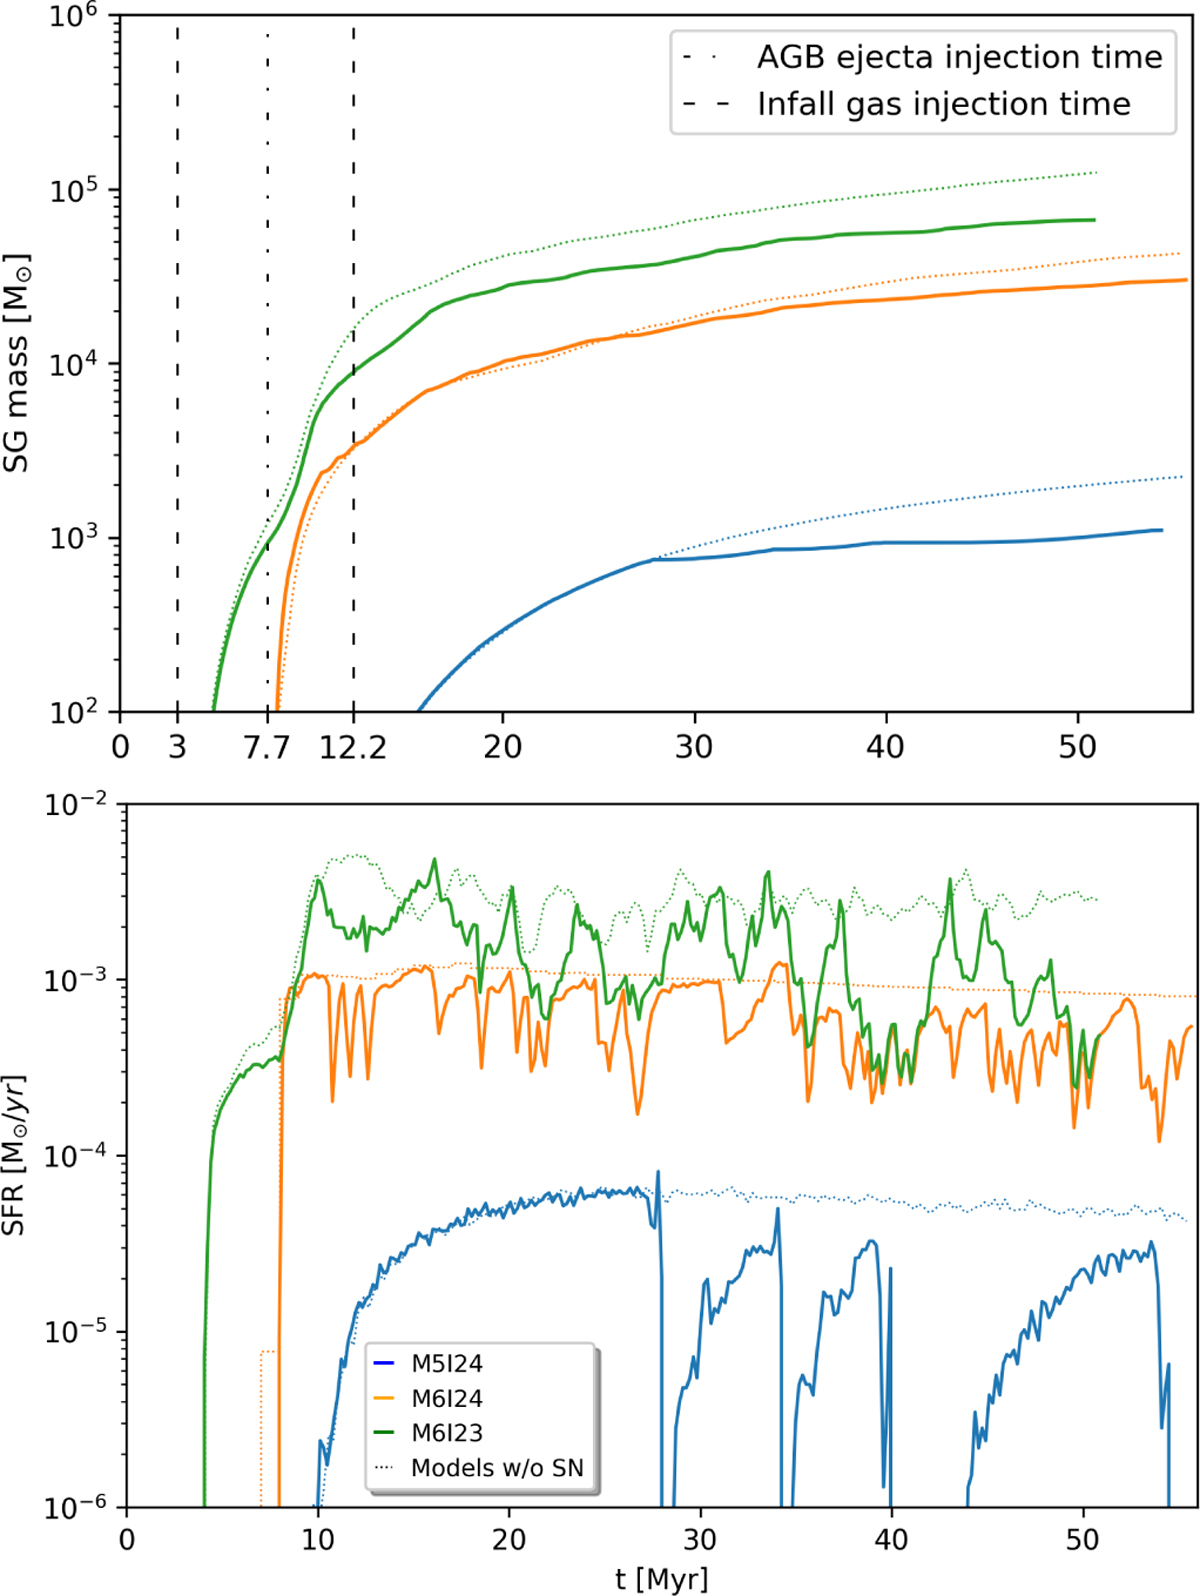
Upper panel: evolution of the SG stellar mass with time. Lower panel: evolution of the SFR with time. Solid lines represent models with Type Ia SNe, whereas dotted lines of the same colour represent the same models but without Type Ia SNe. The blue lines represent the low-mass low-density model while the orange and green lines represent the highmass low- and high-density models, respectively. In the upper panel, the dashed lines show the times at which the infall enters the box, which depends on the model as reported in Table 2. The dash-dotted line displays the beginning of the injection of AGB ejecta, which is the same for all models.
Current usage metrics show cumulative count of Article Views (full-text article views including HTML views, PDF and ePub downloads, according to the available data) and Abstracts Views on Vision4Press platform.
Data correspond to usage on the plateform after 2015. The current usage metrics is available 48-96 hours after online publication and is updated daily on week days.
Initial download of the metrics may take a while.