Open Access
Fig. C.1.
Download original image
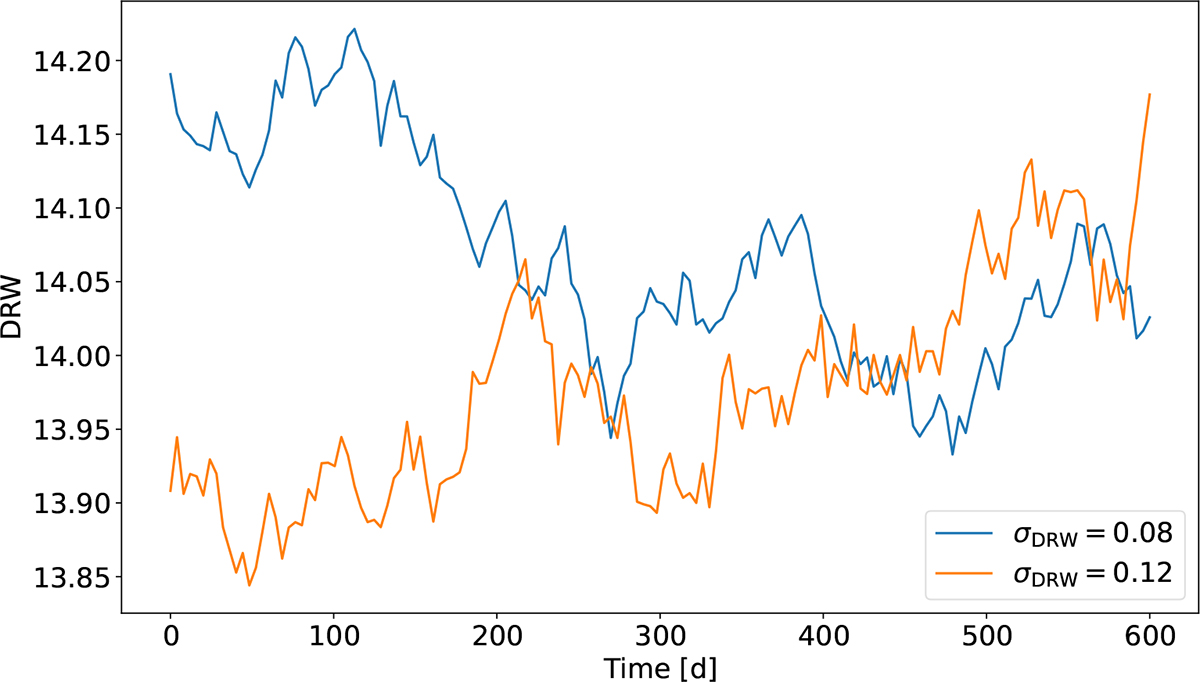
DRW variability used for the realistic scenario and the binary comparison. The blue light curve and the orange light curve correspond to the scenario with σDRW = 0.08, σDRW = 0.12 respectively. The mean value and the characteristic timescale are fixed to μ = 14 and τ = 100 d for both cases.
Current usage metrics show cumulative count of Article Views (full-text article views including HTML views, PDF and ePub downloads, according to the available data) and Abstracts Views on Vision4Press platform.
Data correspond to usage on the plateform after 2015. The current usage metrics is available 48-96 hours after online publication and is updated daily on week days.
Initial download of the metrics may take a while.