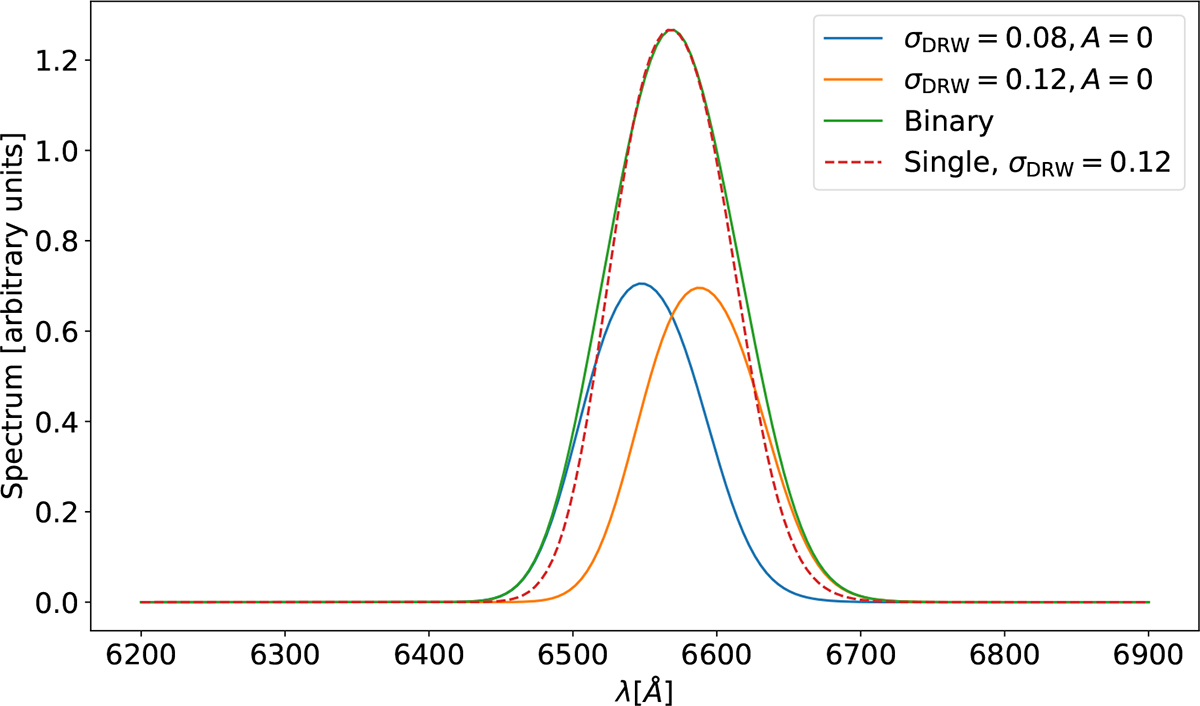
Fig. C.4.
Download original image
Example of a simulated binary spectrum and comparison with the double peaked single SMBH spectra obtained assuming a DRW continuum at tobs = 0. The spectra derived from the light curves in Fig. C.1 with A = 0 (no spiral arms) are shown in blue (σDRW = 0.08) and orange (σDRW = 0.12), while the resulting simulated binary spectrum is plotted in green. To construct the latter, the individual SMBH spectra were shifted to the blue and red by 10 Å each respectively. Additionally, the spectra obtained with the parameters listed in Tab. C.2 assuming a single SMBH and a DRW continuum are also plotted to show the resemblance with the binary BEL.
Current usage metrics show cumulative count of Article Views (full-text article views including HTML views, PDF and ePub downloads, according to the available data) and Abstracts Views on Vision4Press platform.
Data correspond to usage on the plateform after 2015. The current usage metrics is available 48-96 hours after online publication and is updated daily on week days.
Initial download of the metrics may take a while.