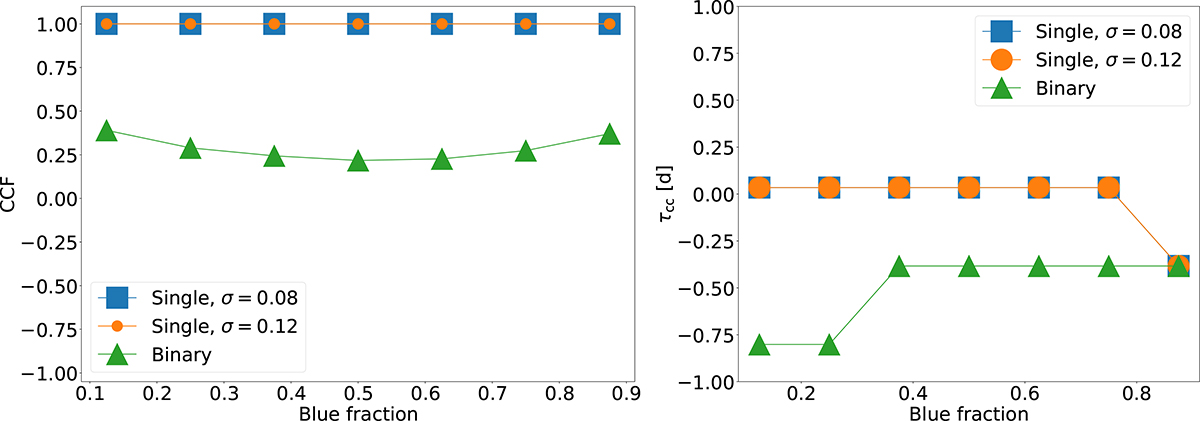
Fig. C.5.
Download original image
On the left panel, CCF results for two single SMBHs and a simulated binary given by the spectra presented in Fig. C.4, as a function of different fractions of the total BEL luminosity in the blue part of the line. On the right panel, the corresponding time delays, i.e. the time shifts that maximize the correlation coefficient. Here, the monotonic decrease is less evident than in Fig. C.2 since the measured delays are smaller than the adopted observational time step.
Current usage metrics show cumulative count of Article Views (full-text article views including HTML views, PDF and ePub downloads, according to the available data) and Abstracts Views on Vision4Press platform.
Data correspond to usage on the plateform after 2015. The current usage metrics is available 48-96 hours after online publication and is updated daily on week days.
Initial download of the metrics may take a while.