Fig. 2.
Download original image
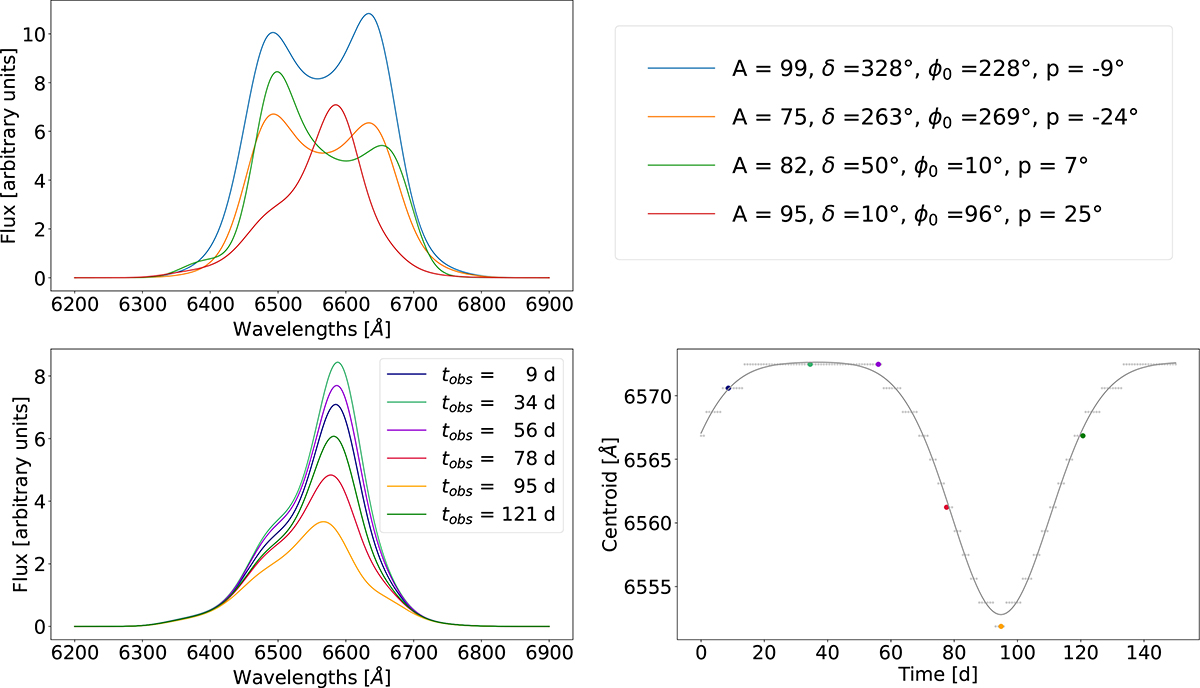
Example of line profiles. In the first row, different BELs obtained at the same time of observation (tobs = 0) for different sets of parameters (listed on the upper right legend). In the second row, the evolution of the BEL obtained by the fourth set of parameters (i.e. the ones associated with the red emission profile in the first row) is shown at different observation times (left) with the corresponding centroid (right).
Current usage metrics show cumulative count of Article Views (full-text article views including HTML views, PDF and ePub downloads, according to the available data) and Abstracts Views on Vision4Press platform.
Data correspond to usage on the plateform after 2015. The current usage metrics is available 48-96 hours after online publication and is updated daily on week days.
Initial download of the metrics may take a while.