Open Access
Fig. 4.
Download original image
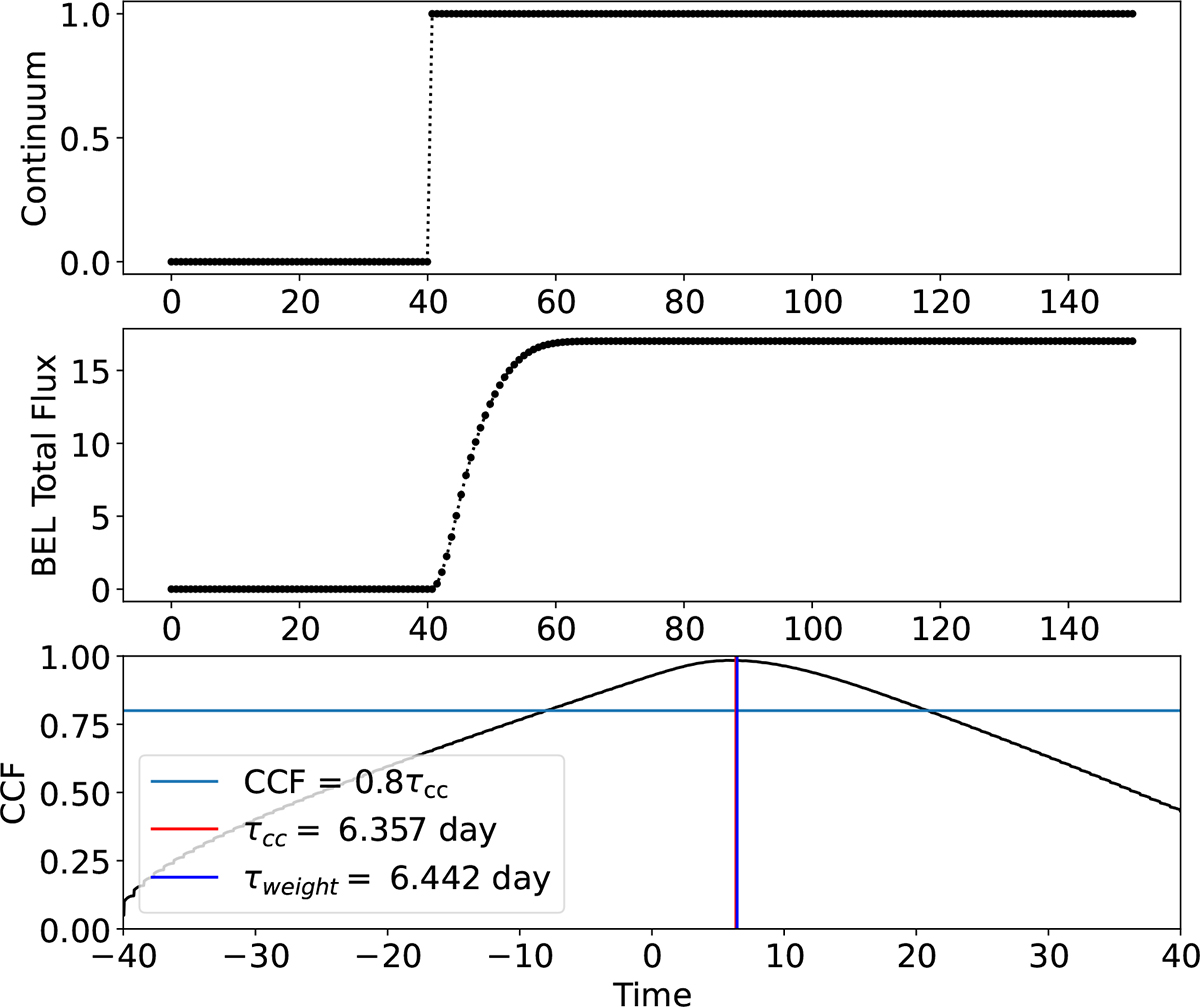
Cross-correlation analysis, assuming a step function continuum (i.e. Eq. (1)). On the upper panel, the continuum luminosity. On the middle panel, the total integrated fluxes of a BEL. Finally, on the lower panel, the cross-correlation computations.
Current usage metrics show cumulative count of Article Views (full-text article views including HTML views, PDF and ePub downloads, according to the available data) and Abstracts Views on Vision4Press platform.
Data correspond to usage on the plateform after 2015. The current usage metrics is available 48-96 hours after online publication and is updated daily on week days.
Initial download of the metrics may take a while.