Fig. 6.
Download original image
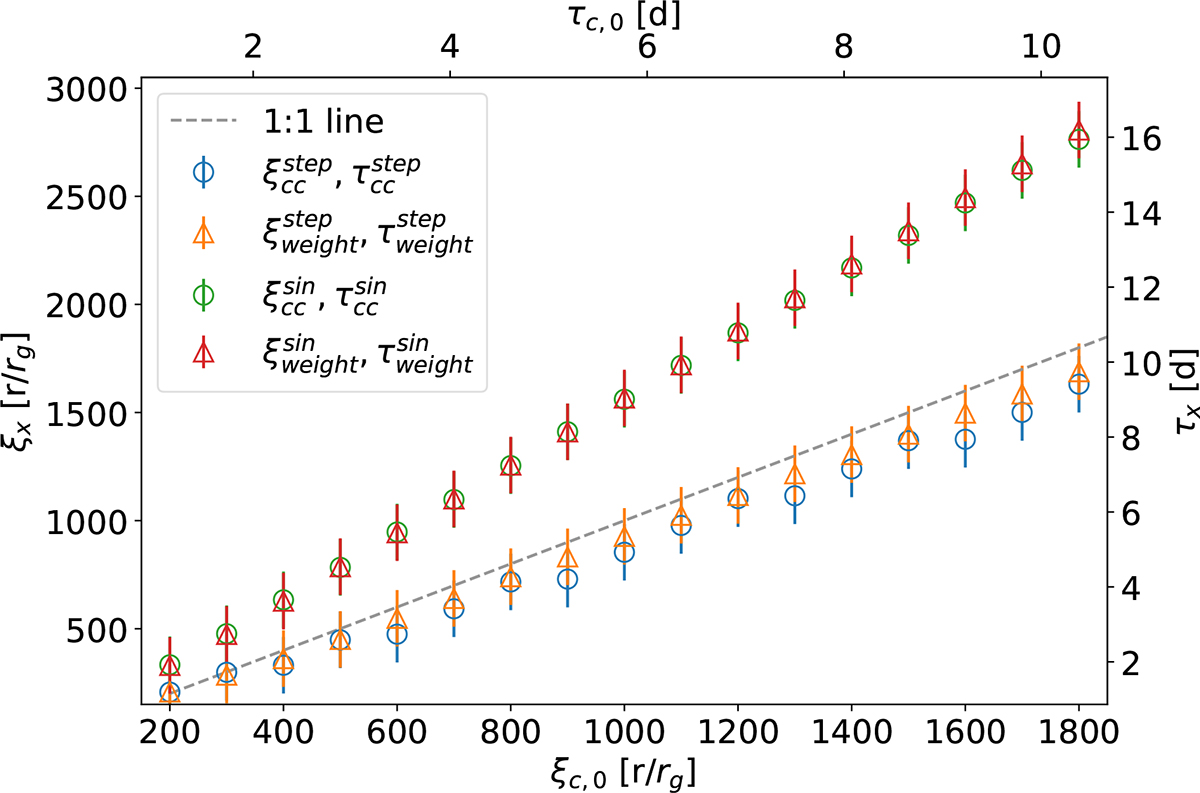
Comparison between the characteristic radius of the BLR obtained by applying reverberation mapping techniques and the radius obtained from the luminosity–radius relation. We show with blue and orange markers the results from the step-function continuum luminosity, while we use green and red markers for the sinusoidal continuum. In both cases, the radius has been estimated considering the maximum of the cross-correlation (represented by circular markers), as well as the weighted average of the time delays (represented by a triangular markers) (see Sect. 3 for further details).
Current usage metrics show cumulative count of Article Views (full-text article views including HTML views, PDF and ePub downloads, according to the available data) and Abstracts Views on Vision4Press platform.
Data correspond to usage on the plateform after 2015. The current usage metrics is available 48-96 hours after online publication and is updated daily on week days.
Initial download of the metrics may take a while.