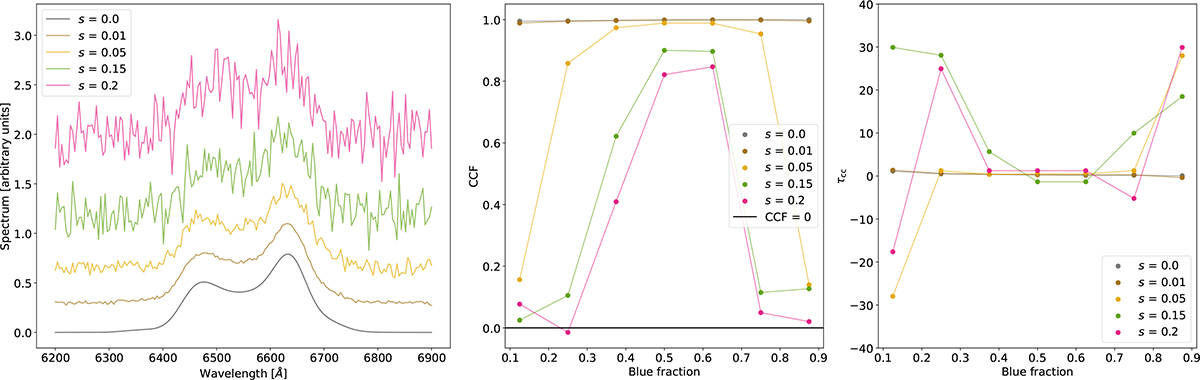
Fig. 8.
Download original image
On the left panel, noise implementation on the profile obtained using the set of parameters listed in Table 2 and the sinusoidal continuum given by Eq. (2) at tobs = 0. Here, we assume Gaussian noise with different values for s, as indicated in the inset. To highlight the effect of the applied Gaussian noise, each BEL is shown with a vertical offset. We stress that only the BEL is plotted, while an AGN spectrum in the broad Hα spectral region would feature, at the very least, the AGN and the host galaxy continua. The negative values of the flux are therefore not unphysical, and should be interpreted as uncertainties on the total (positive) flux. On the central panel, CCF results as a function of the noise. The value of the cross-correlation decreases as the amplitude of the noise increases. The maximum of the cross-correlation remains higher than 0.8 for all the cases considered, in which s remains smaller than the peak value of the BEL flux. On the right panel, time delays corresponding to the time shifts that maximize the correlation coefficient. Note that for asymmetric flux divisions (e.g., a blue fraction of 0.1 or 0.9), the resulting time delays deviate from values close to zero. This occurs because the code was allowed to shift the blue and red part of the BELs over a broader range than what is physically expected. As the flux contributions from the blue and red components become comparable, the time delay that maximizes the cross-correlation coefficient naturally returns to values near zero, as expected.
Current usage metrics show cumulative count of Article Views (full-text article views including HTML views, PDF and ePub downloads, according to the available data) and Abstracts Views on Vision4Press platform.
Data correspond to usage on the plateform after 2015. The current usage metrics is available 48-96 hours after online publication and is updated daily on week days.
Initial download of the metrics may take a while.