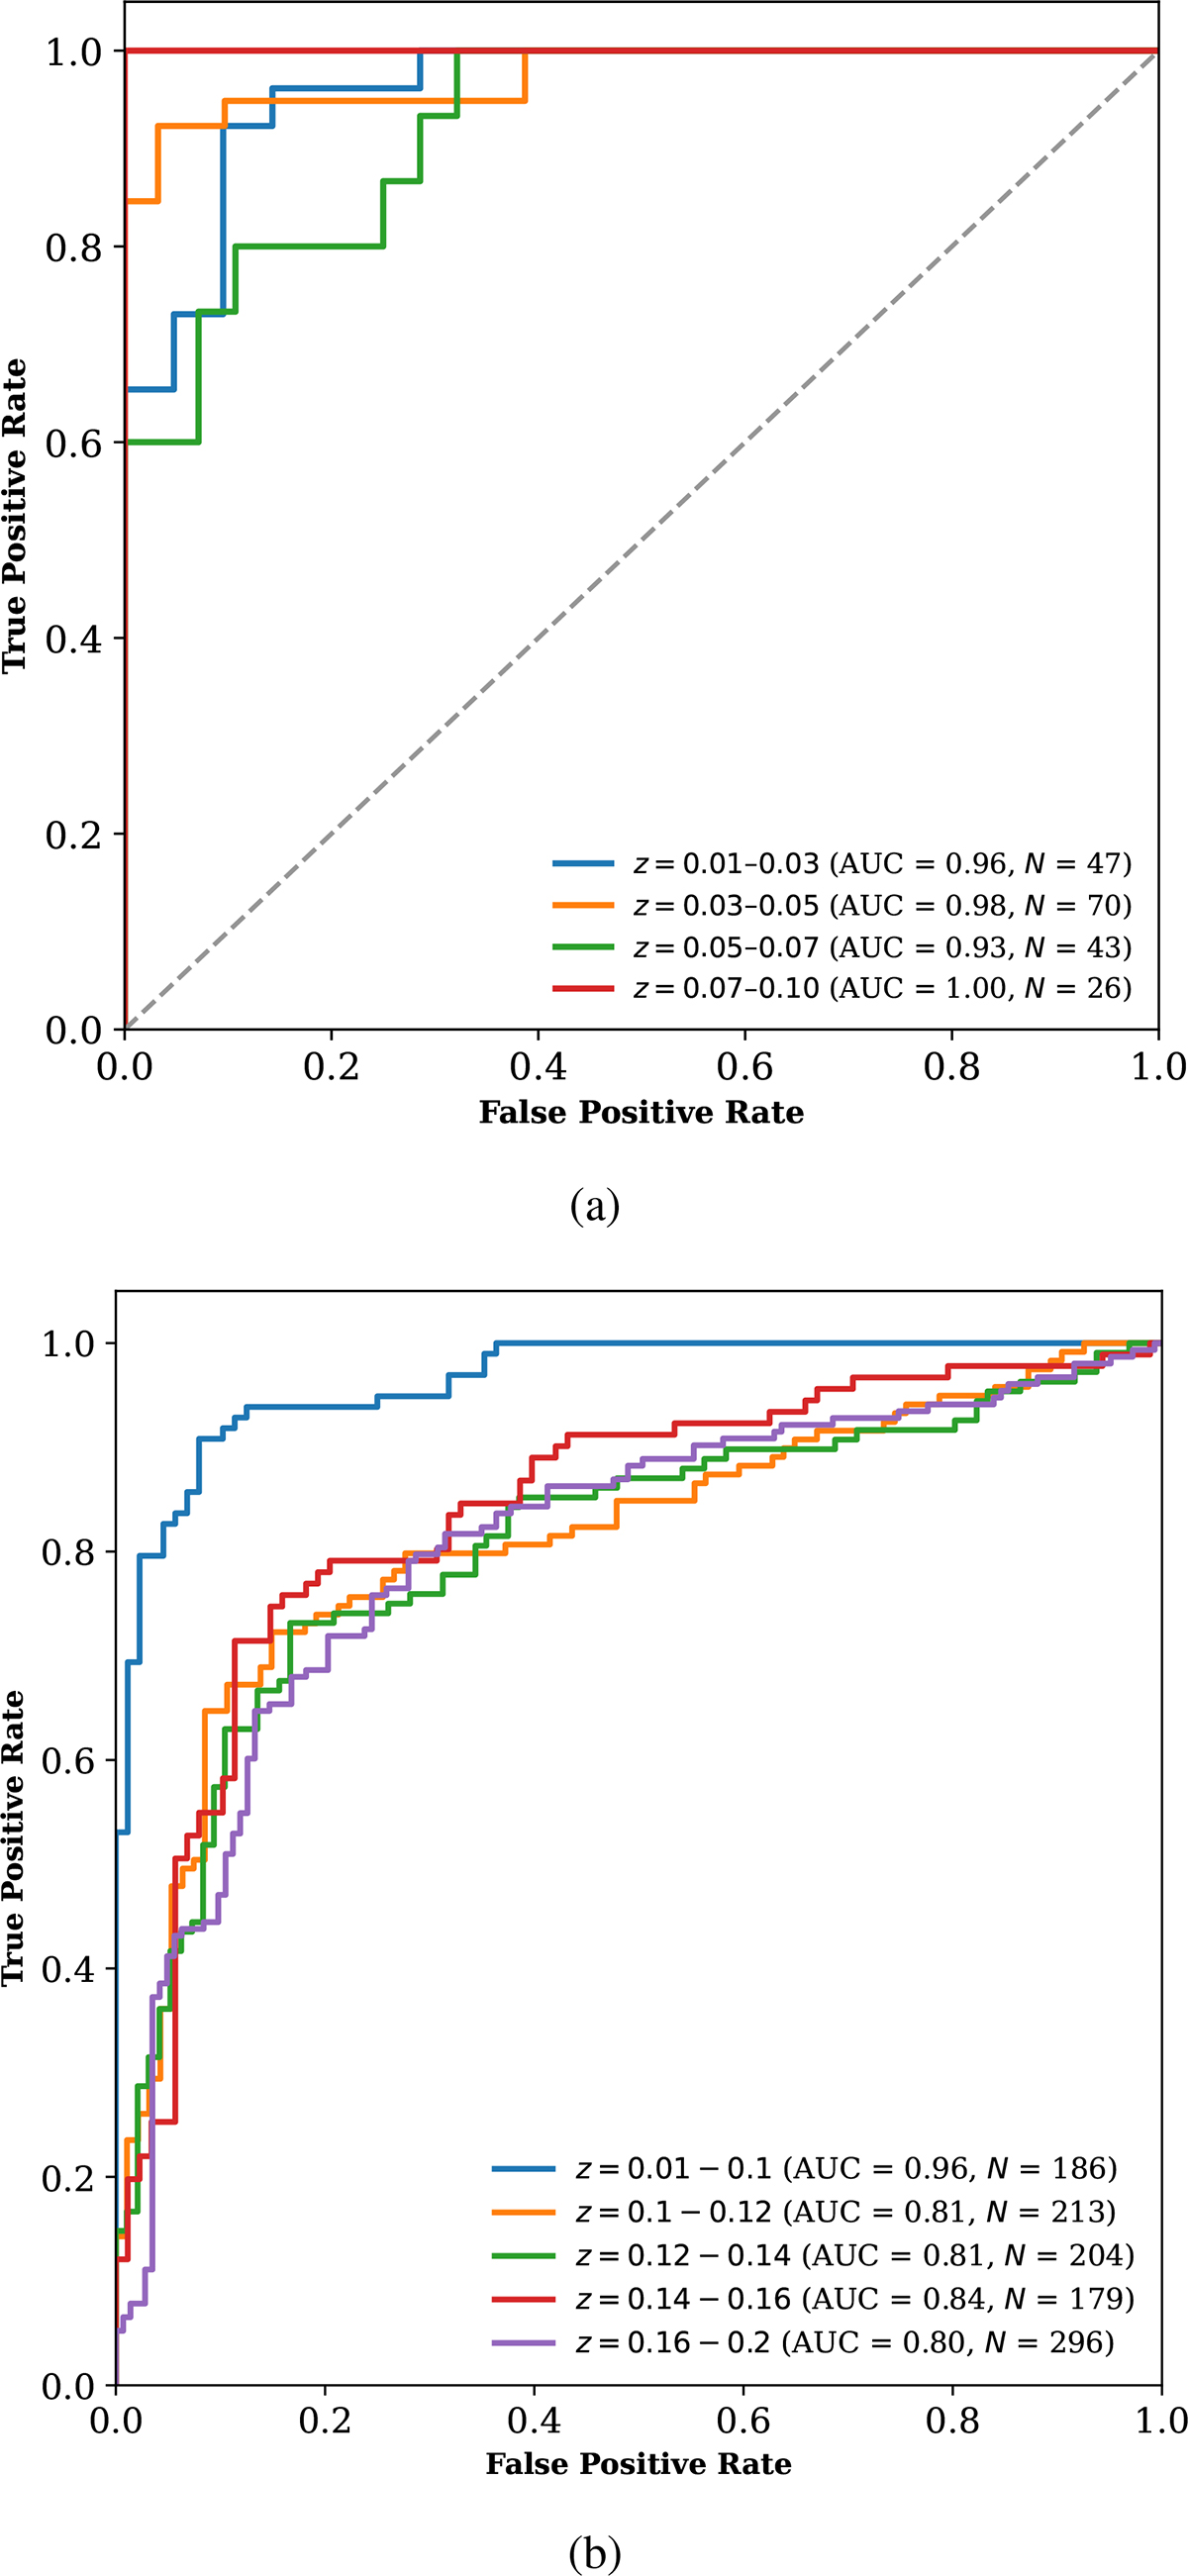
Fig. 10.
Download original image
ROC curves for galaxies at different redshift bins, colour-coded as shown in the legend, with each label also listing the corresponding AUC score and the number of galaxies in the bin N. Top Plot (a) shows the ROC curves for different redshift bins within the low redshift range z = [0.01, 0.1] and the bottom plot (b) shows the ROC curves for different redshift bins within the high redshift range z = [0.1, 0.2], along with the ROC curve for the complete low redshift range z = [0.01, 0.1] shown for comparison.
Current usage metrics show cumulative count of Article Views (full-text article views including HTML views, PDF and ePub downloads, according to the available data) and Abstracts Views on Vision4Press platform.
Data correspond to usage on the plateform after 2015. The current usage metrics is available 48-96 hours after online publication and is updated daily on week days.
Initial download of the metrics may take a while.